1. INTRODUCTION
Climate change is one of the most significant environmental challenges worldwide (Kim et al., 2026; Stewart et al., 2026). Several studies emphasize significant warming in recent decades (Herrera et al., 2023). Its impacts are more and more felt across various sectors, mainly water resources (Mengistu et al., 2025), threatening both their availability and quality (Tercini et al., 2021).
The Mediterranean basin is one of the most vulnerable regions to climate change (Baycan et al., 2025) as a result of the warming, altered circulation, and water resource depletion (Nikolova et al., 2026). The change results in increased intensity and frequency of extreme weather events, including severe droughts and recurrent violent floods, causing devastating inundations (Polychroni et al., 2026). Significant spatial and temporal variability is highlighted across the Mediterranean (Vicente-Serrano et al., 2025). Many researchers have documented an alteration in the rainfall regime (Boughdadi et al., 2024). Nistor & Man (2019) reported a strong decrease in precipitation throughout the 21st century. Raymond et al. (2016) stated a decrease in rainy days at the annual scale and in precipitation amounts during the wet season.
Based on daily data collected from southeastern Spain, Valdés-Abellán et al. (2017) found that there was a substantial change in the yearly rainfall pattern with reductions of around 15 %. Additionally, Deitch et al. (2017) looked at spatial variability and long-term trends of precipitation globally in areas of a Mediterranean climate, locating statistically significant reductions in annual rainfall at many sites. The highest values were observed in Spain and Northern Italy. In northern Algeria, Achite et al. (2025) reported an increase in recurrence and intensity of drought events related to climate change.
Morocco, located at the extreme southwest of the Mediterranean, experiences considerable variability in its weather conditions (Driouech et al., 2009), characterized by periods of prolonged drought as well as episodes of intense rainfall and flooding. Numerous previous studies have documented these fluctuations. Tramblay et al. (2013) observed an increase in dry spells in northern Morocco, accompanied by a reduction in overall precipitation and a decrease in the number of rainy days. These findings were corroborated by Filahi et al. (2016), who also reported a distinct trend toward drier conditions, although there is no significant long-term change detected in the extreme rainfall events across the country. Only some regions in northern and central Morocco exhibit notable trends (Filahi et al., 2016).
Many works have tried to improve the understanding of large-scale rainfall patterns across Morocco. Research carried out by Singla et al. (2010) on twenty-seven Moroccan basins found a small increase in precipitation in the northern Rif mountains. Nevertheless, a significant decrease is evident in other parts of the country since the late 1970s. In the Sebou basin, Kessabi et al. (2022) observed an overall decline in the annual total rainfall. At the seasonal level, the same study had reported a small increase in autumn, while winter, spring, and summer all exhibit a negative trend. In lower Sebou, Hakam et al. (2022) found a decrease in rainfall for early winter (December) and early spring (March) of 0.42 and 0.50 mm/year, respectively. Bouchaou et al. (2011) reported a similar general decline in the Souss-Massa basin. In the Oum Er-Rbia basin, the changes in climate have affected hydroclimatic pattern (Ouatiki et al., 2019), with evident trend towards drier conditions. High recurrent years (50 - 63 %) show deficits in precipitation after 1980 - 1981. At the upstream of the Oum Er Rbia river, in a mountainous region with a Mediterranean climate (Martin, 1981), the El Hansali Dam basin sustains the critical low-flow regime of this vital river. However, due to climate instability, there has been a substantial decline in the amount of groundwater storage, threatening the hydrologic situation of the basin (Tahiri et al., 2022). Water resource availability depends largely on precipitation amounts, which themselves are highly affected by climate variability.
Despite their increasing number, most works on rainfall patterns in Morocco focus on their various aspects separately, and often at the annual scale. Only a few studies used an integrated, multi-temporal approach. Some of them have focused on the trend, relying primarily on the classical Mann-Kendall and Sen's slope tests (En-Nagre et al., 2024; Hakam et al., 2022). Other studies have attempted to characterize rainfall variability using statistical indices such as the coefficient of variation (El Qorchi et al., 2023) or rainfall concentration indices (Salhi et al., 2019). Another relevant aspect that has received research attention is drought assessment, which relies primarily on the Standardized Precipitation Index (Ouatiki et al., 2019; Zian et al., 2024). Consequently, there is a real need for innovative methods together with classical ones to investigate trends in detail. In particular, the Innovative Trend Analysis (ITA), which identifies non-monotonic and amplitude-dependent trends in precipitation data (Wu & Qian, 2017), has not been sufficiently studied in the semi-arid basins of Morocco.
To address this gap, this work utilizes a comprehensive assessment that integrates precipitation variability, drought assessment, and trend analysis across different timescales. It aims to improve the current understanding of precipitation patterns’ evolution within the semi-arid Mediterranean region through the case of the upper Oum Er-Rbia Basin. The assessment is based on data from six rain gauge stations, which reflect the altitudinal and climatic gradients across the basin. A dataset of more than five decades (1970 - 2022) of records increases the reliability of the conclusions from these analyses.
The significance of this study lies in its integrated, multi-timescale methodological approach (annual, seasonal, and monthly), combining precipitation variability indicators, the Standardized Precipitation Index (SPI), and complementary trend detection methods. The Mann-Kendall test identifies the statistical significance of monotonic trends, while Sen's slope quantifies their magnitude (mm per unit time). Innovative trend analysis (ITA) provides additional information by detecting the differentiated behavior of low, average, and heavy rainfall.
2. MATERIALS AND METHODS
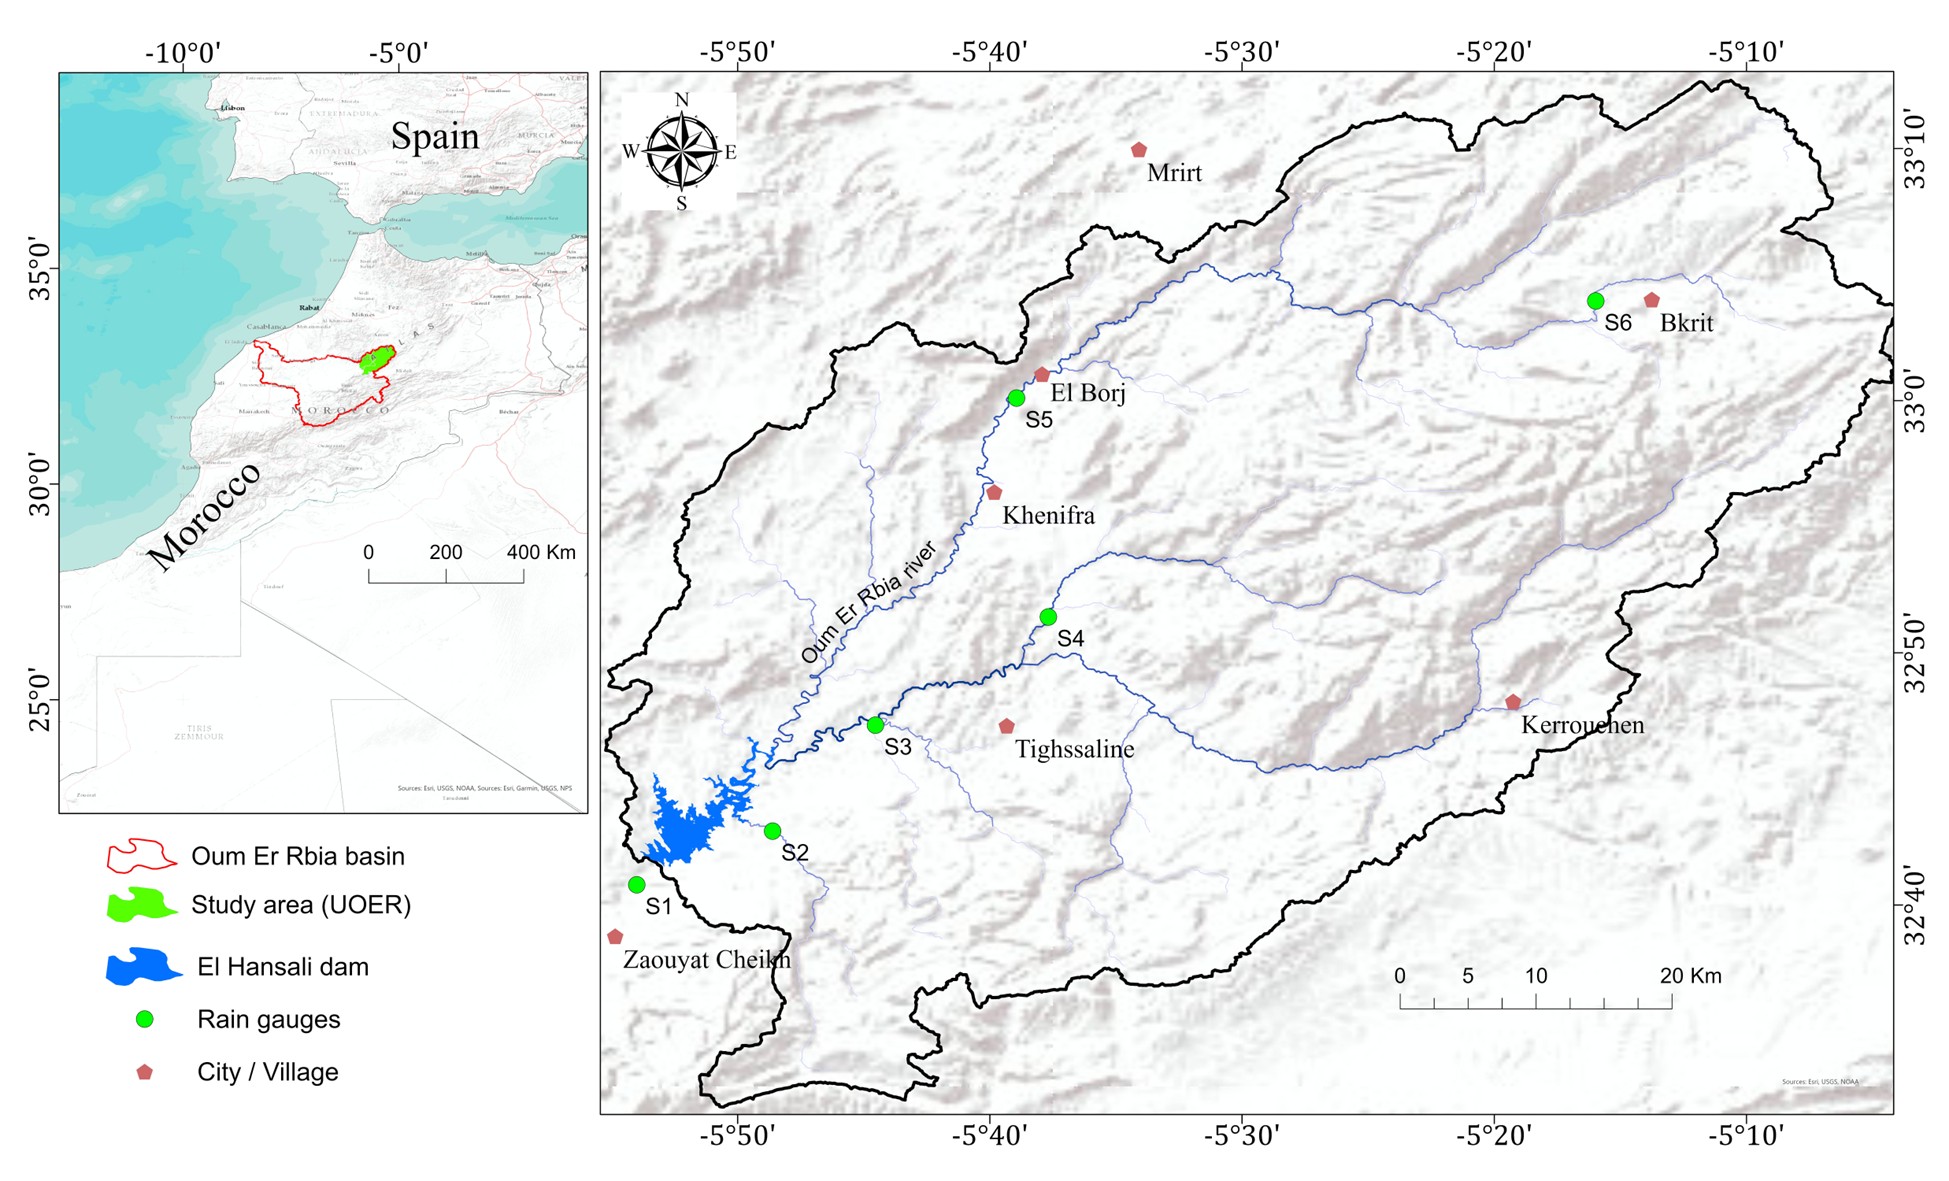
2.1. Study area
The study area is located mostly in the Middle Atlas. It covers the most northeastern part of the Oum Er-Rbia basin, upstream of El Hansali Dam (Figure 1), spanning an area of 3,389 km². The altitude ranges from 600 m to nearly 2,400 m (Midaoui et al., 2024). The Liassic carbonate cover predominates. It rests on Triassic clays and Paleozoic schist bedrock, and promotes the continuous resurgence of numerous Vauclusian springs. The most important are those of the Oum Er-Rbia (Bentayeb & Leclerc, 1977). Hydrologically, the basin is drained by the Oum Er-Rbia River, which originates in the Bekrit syncline (Oued Fellat). It flows towards the Ahmed El Hansali Dam, with a network of tributaries, the main one being the Oued Serou. The region is characterized by a mountainous Mediterranean climate, with a mean annual rainfall of approximately 570 mm, calculated over a period of 52 years (1970 - 2022) of data obtained from the Oum Er-Rbia River Basin Agency.
2.2. Used rainfall data
This study utilized monthly rainfall time series provided by the Oum Er-Rbia Hydraulic Basin Agency (ABHOER), the body responsible for the mobilization, management, and planning of water resources at the watershed scale. The data cover the period from September 1970 to August 2022, ensuring adequate temporal coverage for climate variability assessment and long-term trend detection (OMM & GWP, 2016). The dataset includes observations from six rain gauges, retained for their representative altitudinal gradient (Table 1) and their spatial distribution covering the main geographical areas of the basin (Figure 1). The rainfall series used in this study had previously undergone rigorous quality control and homogeneity test in our earlier work (El-Hamdouny et al., 2025). To identify outliers, fill missing data, and remove non-climatic inhomogeneities, we used the Reduced Major Axis (RMA) and the Standard Normal Homogeneity Test (SNHT) methods.
|
Table 1. Rain gauge Stations in the Upper Oum Er-Rbia. |
|||
|
Stations |
Longitude (°) |
Latitude (°) |
Elevation (m) |
|
Dchar El Oued (S1) |
-5.90 |
32.68 |
595 |
|
Taghzoute (S2) |
-5.80 |
32.71 |
690 |
|
Chacha N’Amellah (S3) |
-5.74 |
32.78 |
685 |
|
Aval El Heri (S4) |
-5.63 |
32.86 |
830 |
|
Tarhat (S5) |
-5.65 |
33.00 |
1036 |
|
Tamchachat (S6) |
-5.27 |
33.07 |
1685 |
2.3. Methodology
2.3.1. Workflow
Figure 2 shows the sequence of data processing and analysis steps used in this study, from raw rainfall records to the production of final analytical results. In the first step, monthly rainfall data were preprocessed to extract the annual total based on hydrological year (Sep to Aug). Using the same procedure, seasonal rainfall amounts were calculated for autumn (Sep – Nov), winter (Dec - Feb), spring (Mar - May), and summer (Jun - Aug). The resulting multiscale data set was then processed in the R environment and Excel.
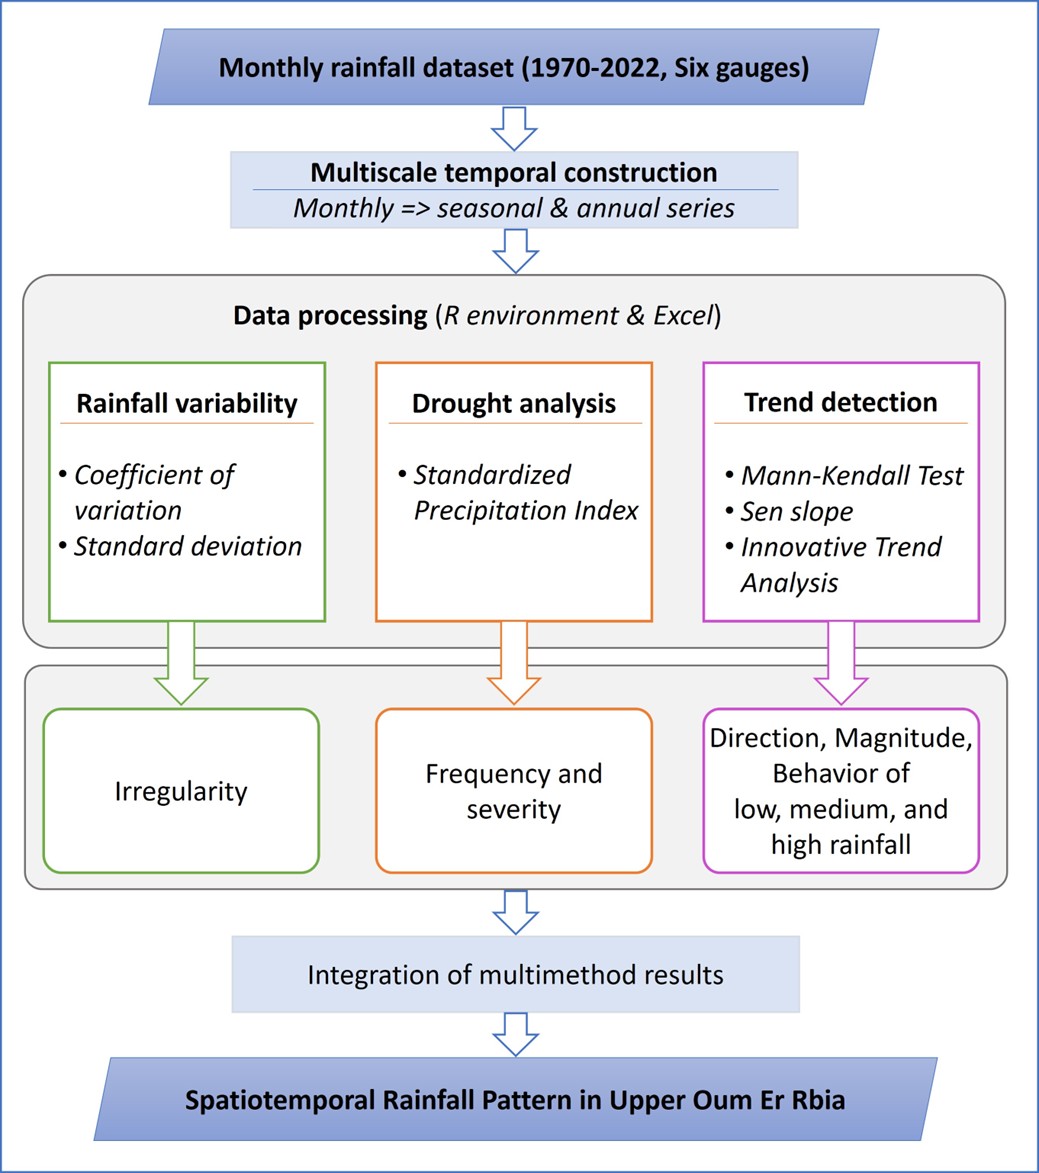
Three analytical components were implemented in parallel. The first one focused on rainfall variability and included an exploratory statistical analysis by calculating descriptive indicators, including standard deviation and coefficient of variation. The second component included drought analysis based on the Standardized Precipitation Index. SPI values were calculated using the “SPEI” package and were used to determine the frequency and severity of drought. The third component dealt with trend detection using a complementary statistical and graphical method (Malik et al., 2019). To identify trend direction and magnitude, we used the Mann-Kendall test with Sen's slope, while we used the Innovative Trend Analysis to detect specific trend in low, medium, and high values separately. The “trend” and “trendchange” packages helped to achieve this work within the R environment. Finally, the analysis of the outputs from these three components converges to a consistent precipitation characterization in the Upper Oum Er-Rbia basin.
2.3.2. Rainfall variability
To quantify the temporal variability of rainfall, we conducted a statistical analysis based notably on the coefficient of variation CV (Mekuria et al., 2025; Orke & Li, 2021). It measures relative data dispersion around the mean in a normalized way. Three categories of rainfall variability are distinguished (Belay et al., 2021; Pawar et al., 2022): low (CV < 20 %) indicates stable rainfall conditions with limited variability, moderate (20 % ≤ CV ≤ 30 %) references occasional variability, and high (CV > 30%) denotes pronounced alternating wet and dry years.
2.3.3. Drought analysis based on SPI index
The SPI method was proposed by McKee et al. (1993). It has become a widely used climatic indicator (Jain et al., 2015; Stricevic et al., 2011), especially in drought warning and forecasting systems (Bonaccorso et al., 2015; Park et al., 2018). It was recommended by the World Meteorological Organization as a reference index for monitoring meteorological droughts (OMM, 2012). The robustness and simplicity of this method, combined with its processing flexibility, explain its approbation for characterizing drought severity (Tri et al., 2019). According to Ghazi et al. (2025), the SPI's adaptability to different time scales makes it a useful index widely employed to assess the frequency and severity of droughts under climate change.
The SPI computation consists of transforming positively skewed precipitation series into a normally distributed series, allowing direct comparison of wet and dry conditions across time and space, independently of climatic regime. The process involves constructing rainfall series at a specific accumulation period (number of months), fitting a Gamma probability distribution, and calculating the Cumulative function F(x), which is transformed into a standard normal variable, representing the SPI value (Equation 1).

with Φ-1 denotes the inverse cumulative function of the standard normal distribution with mean μ=0 and standard deviation σ=1.
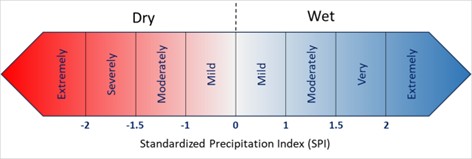
In this study, the 3-month and 12-month SPI were computed to capture seasonal and annual drought variability, respectively. The process results in one value per month regardless of the accumulation scale. To characterize seasonal drought, we extracted the SPI value of the terminal month of each season (e.g., November for autumn), as it reflects the cumulative moisture conditions at the end of the period. Similarly, for the annual analysis, the SPI of August (end of hydrological year) was used. According to McKee et al. (1993), drought events are identified by consecutive negative SPI values, while positive values indicate wetter-than-normal conditions. The drought intensity is summarized in Figure 3.
2.3.4. Trend analysis with Mann–Kendall test
The Mann-Kendall test (Kendall, 1975; Mann, 1945) is commonly used in evaluating long-term trends (Zhang et al., 2001). It doesn’t require specific assumptions about data distribution, and it is robust to outliers. It reliably detects monotonic trends, whether upward or downward, in time series (Lu et al., 2015). In addition to these advantages, the Mann-Kendall test is used here because it is well-suited to the skewed nature of rainfall data, and because it is compatible with and complements the Sen's slope method.
The test is based on the relative magnitudes of the values (Gilbert, 1987). A test statistic S is calculated based on the sign of the differences between pairs of values in the time series (Equation 2). Each value in the time series is compared to those preceding it, giving a total of n(n−1)/2 pairs, where n is the number of observations in the series. Starting from zero, S is incremented by 1 when the difference is positive and decremented by 1 when it is negative. The premise is that if a trend is present, the value of S will tend to increase or decrease monotonically. A positive (negative) S designates an increasing (decreasing) trend.

where xi and xj denote observations at time i and j respectively, with j>i, and n is the total number of observations.
To quantify the reliability of the trend, the normalized test statistic Z is therefore calculated based on the values of S and its variance Var(S) (Equation 3).
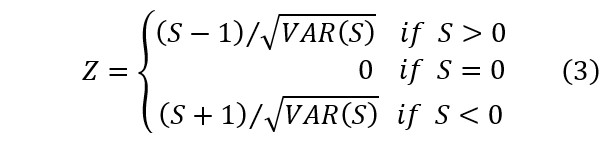
Z is distributed normally Z~Ν(0,1). The trend is significant if the computed probability is less than the significance level (5 % as default).
No pre-whitening procedure was applied, as precipitation series are generally characterized by weak persistence. A global analysis conducted by Sun et al. (2018) shows that more than 76 % of land-based precipitation records exhibit no significant lag-1 autocorrelation.
2.3.5. Sen's Slope trend magnitude estimator
Originally proposed by Sen (1968), Sen’s slope method estimates the trend slope as the median of all pairwise slopes between data points (Equation 4). Its robustness to outliers and large fluctuations makes it particularly suitable for hydroclimatic time series. A positive (negative) value of the median slope indicates an increasing (decreasing) trend.

Q(i,j) is the slope between data points xi and xj.
2.3.6. Innovative Trend Analysis
The Innovative Trend Analysis (ITA) proposed by Şen (2012), is a non-parametric and widely used method (Serinaldi et al., 2020). Unlike classical tests, which evaluate a single monotonic trend over the entire time series (Hamed, 2008; Yue & Wang, 2004), a key advantage of ITA is its ability to reveal trend behaviors hidden in low, medium, and high values within the same dataset, which are often masked by global trend tests (Kisi & Ay, 2014; Öztopal & Şen, 2017). This characteristic is very useful for rainfall analysis in a semi-arid Mediterranean climate, with high variability and very frequent extreme events. Furthermore, the ITA method provides a graphical representation that allows an intuitive interpretation of trends (Buyukyildiz, 2023).
The procedure consists of dividing the time series into two equal sub-periods. Each sub-series is then sorted independently, and a scatter plot is constructed based on the first half (xi) and the second half (yi) (Addou et al., 2024). The 45° diagonal line represents the no-trend condition, points located above the diagonal indicate an increasing trend, whereas points below indicate a decreasing trend (Şen, 2014).
Quantitative indicators can be derived to support graphical interpretation. The ITA trend indicator 𝐷 (Equation 5) is defined as the mean of the normalized differences between the two sub-series. Normalization is performed using the mean of the first half, considered the reference period for change detection.

where n represent the number of observations in each sub-series, xi and yi are the sorted values of the first and the second halves, respectively, and x ̅ is the mean of the first half.
The ITA trend slope SITA is estimated using equation 6 (Modaresi et al., 2025; Şen, 2017).

where N denote the total number of data, x ̅ and y ̅ are the means of the two halves, CL1-α is the confidence limit at the α percent significance level, scri is the critical value of the Gaussian distribution function, σs is the standard deviation of all data, and ρy,x is the correlation coefficient of the two sub-series.
3. RESULTS
3.1. Spatiotemporal rainfall variability
3.1.1. Annual variability
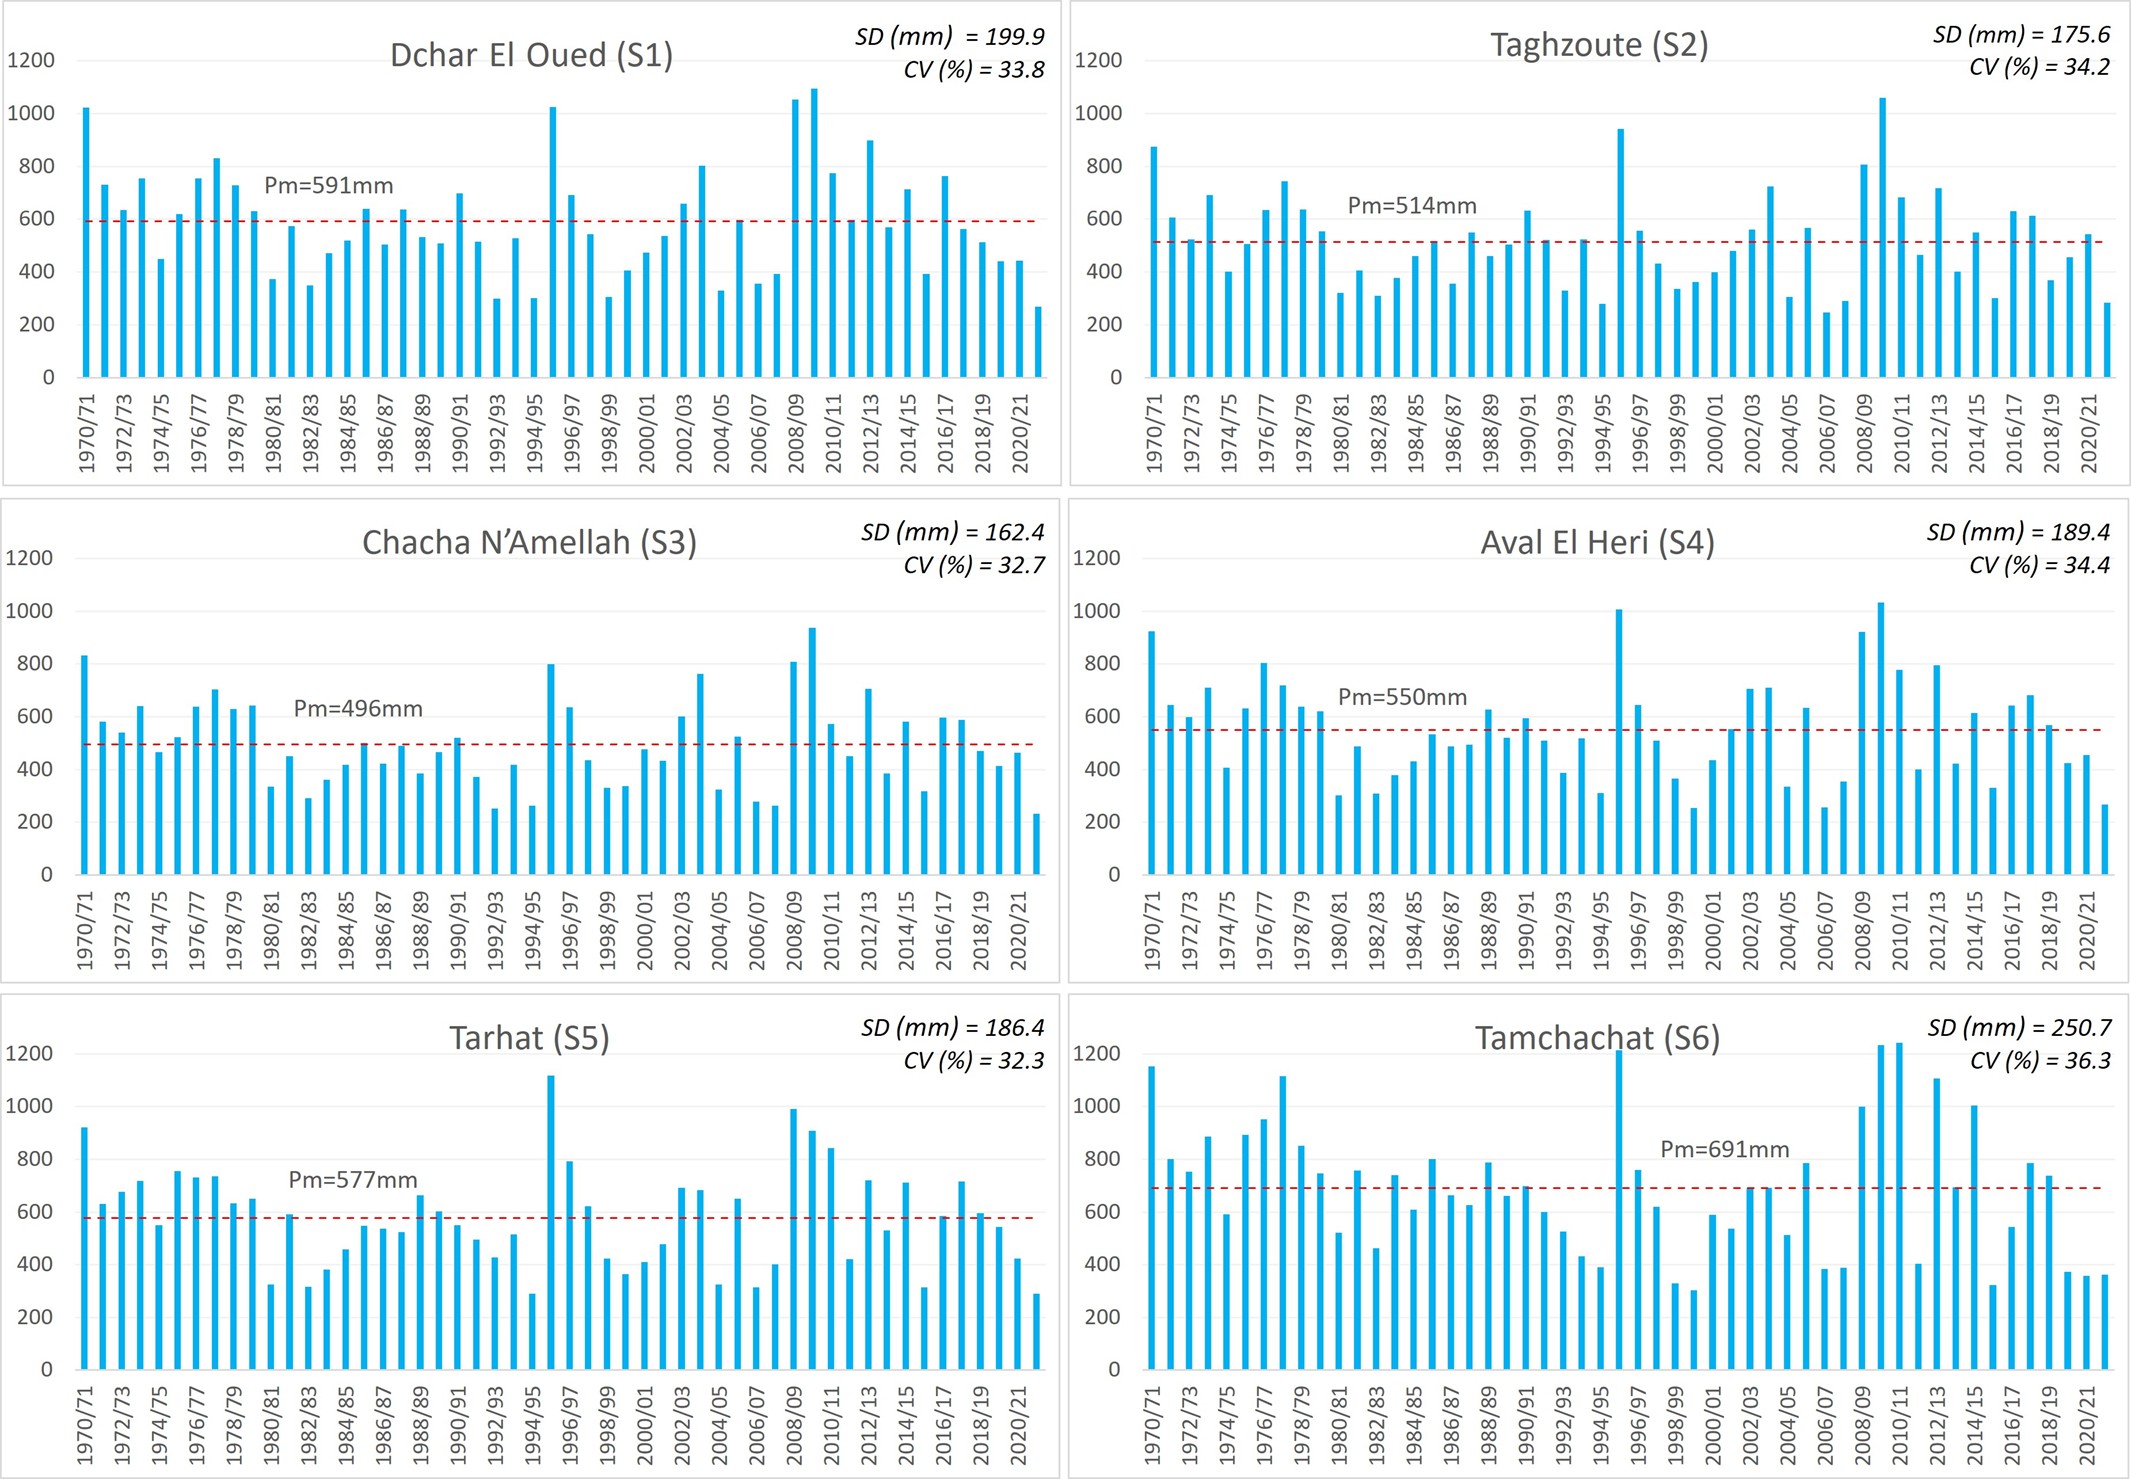
The exploratory statistical analysis over the 1970 - 2022 period reveals strong interannual variability of total rainfall in all stations (Figure 4). Exceptionally rainy years, such as 1995/1996 and 2009/2010, contrast sharply with dry years including 1994/1995 and 2015/2016. Mean annual rainfall increases from 496 mm at the centrally located Chacha N’Amellah station (S3) to 691 mm at the Tamchachat station (S6) in the upstream mountainous areas (Figure 1). The standard deviation (SD) shows more pronounced variability at Tamchachat (S6) with higher values (250.7 mm), compared to Chacha N’Amellah (S3), which exhibits the lowest SD (162.4 mm). The Coefficient of Variation (CV), which quantifies relative dispersion, ranges between 32.3 % at Tarhat (S5) and 36.3 % at Tamchachat (S6).
3.1.2. Seasonal variability
Table 2 shows that winter, the wettest season, records average rainfall exceeding 200 mm at all stations, with a maximum of 280.6 mm at station S6. The CV exhibits significant interannual variability (59 - 66 % depending on the station). Autumn and spring show comparable intermediate rainfall levels but differ in their variability; autumn is characterized by higher CV (> 60 %) than spring (54 - 60 %). Summer rainfall remains marginal (> 50 mm) but is distinguished by extremely high variability (CV can exceed 100 %).
|
Table 2. Descriptive statistics (in mm) of seasonal rainfall series at the six stations (S1–S6). |
||||||
|
Mean |
Max |
Min |
SD |
CV (%) |
||
|
Autumn |
S1 |
146.2 |
481.3 |
1.5 |
98.9 |
67.6 |
|
S2 |
122.1 |
367.8 |
0.0 |
79.2 |
64.9 |
|
|
S3 |
116.9 |
389.5 |
13.0 |
79.8 |
68.3 |
|
|
S4 |
126.6 |
408.5 |
7.3 |
89.9 |
71.0 |
|
|
S5 |
133.8 |
345.9 |
11.0 |
83.7 |
62.6 |
|
|
S6 |
164.1 |
489.2 |
0.0 |
101.2 |
61.7 |
|
|
Winter |
S1 |
237.4 |
703.0 |
41.6 |
140.3 |
59.1 |
|
S2 |
206.2 |
691.9 |
45.7 |
124.0 |
60.1 |
|
|
S3 |
201.6 |
638.6 |
39.2 |
126.1 |
62.5 |
|
|
S4 |
221.9 |
697.3 |
46.8 |
140.3 |
63.2 |
|
|
S5 |
224.9 |
617.0 |
58.8 |
135.6 |
60.3 |
|
|
S6 |
280.6 |
952.5 |
36.9 |
183.7 |
65.5 |
|
|
Spring |
S1 |
185.5 |
578.9 |
26.1 |
105.9 |
57.1 |
|
S2 |
168.5 |
328.1 |
23.4 |
91.9 |
54.6 |
|
|
S3 |
156.2 |
295.2 |
22.5 |
83.9 |
53.7 |
|
|
S4 |
170.5 |
351.3 |
35.4 |
97.8 |
57.4 |
|
|
S5 |
173.1 |
364.4 |
25.7 |
93.8 |
54.2 |
|
|
S6 |
207.5 |
488.7 |
28.7 |
124.0 |
59.8 |
|
|
Summer |
S1 |
22.1 |
99.1 |
0.0 |
21.8 |
98.8 |
|
S2 |
17.2 |
85.8 |
0.0 |
17.0 |
98.8 |
|
|
S3 |
21.5 |
97.4 |
0.7 |
22.1 |
103.0 |
|
|
S4 |
31.5 |
93.9 |
0.0 |
24.3 |
77.1 |
|
|
S5 |
45.7 |
238.7 |
0.5 |
43.3 |
94.8 |
|
|
S6 |
38.9 |
151.0 |
0.0 |
33.8 |
86.9 |
|
3.2. Drought analyses based on SPI
3.2.1. Annual SPI results
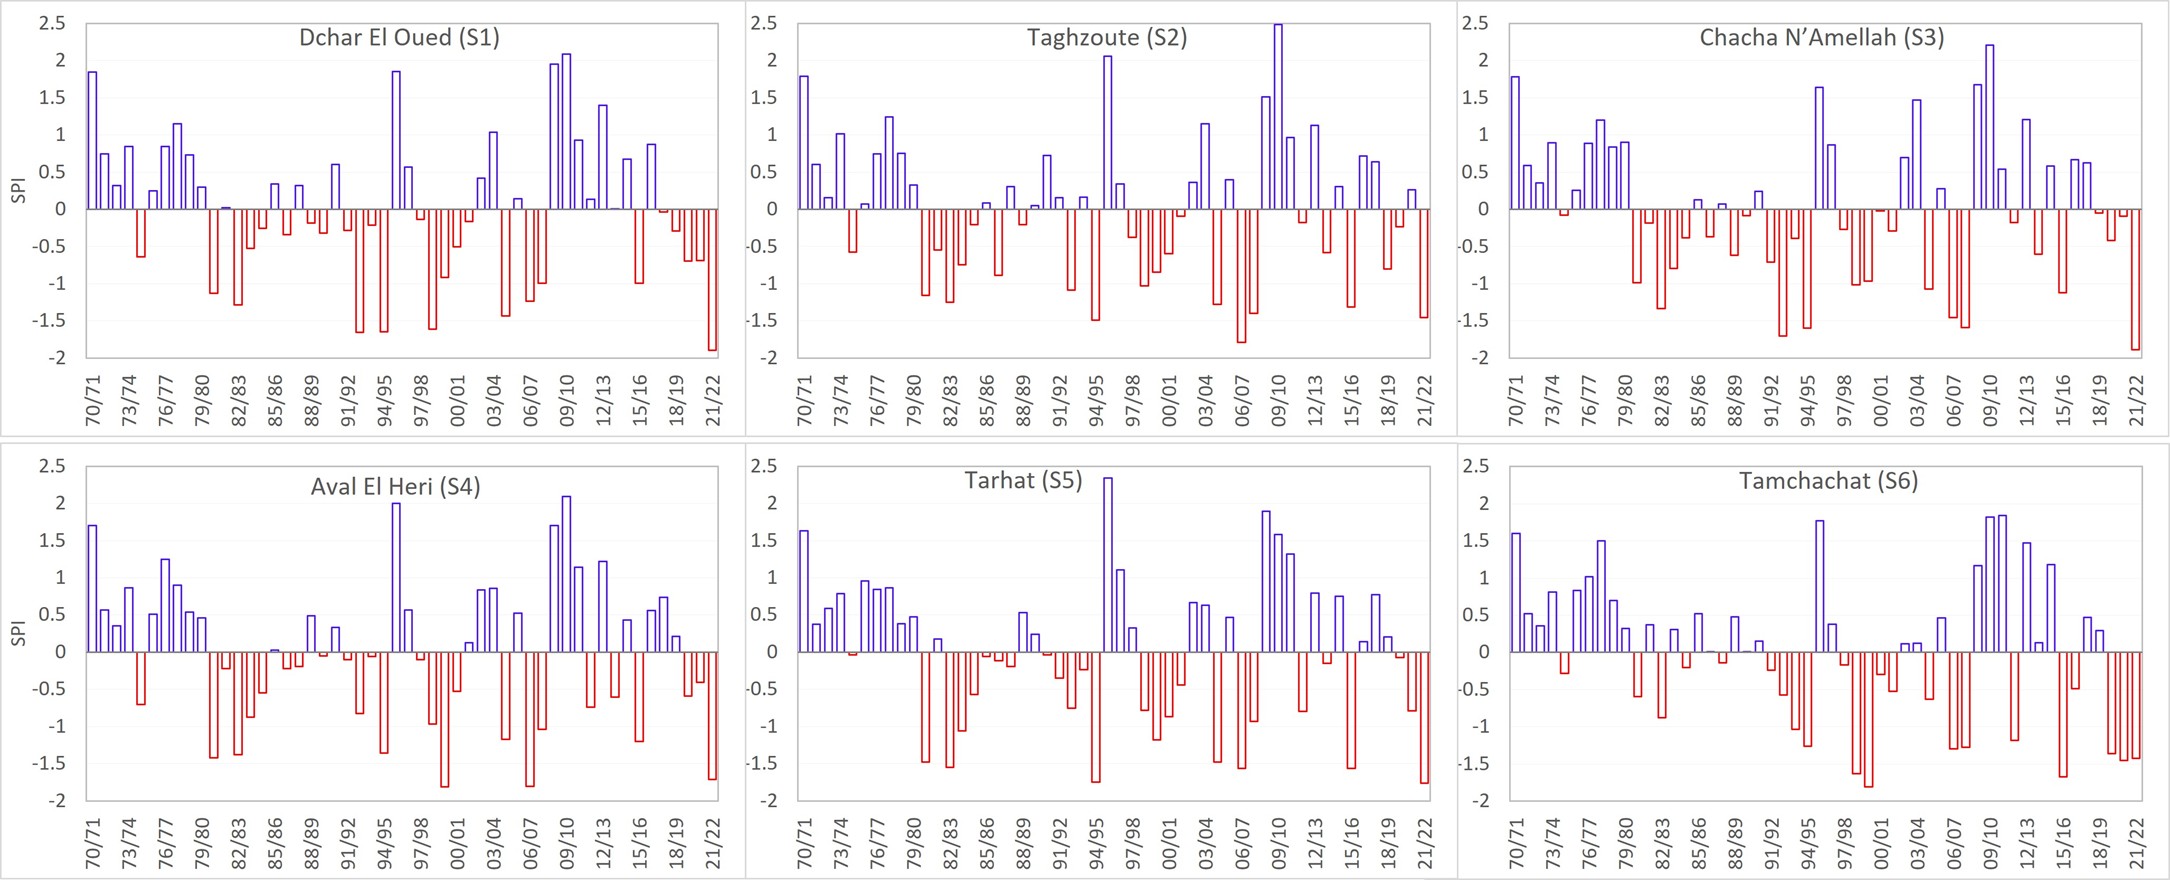
The annual SPI series (Figure 5) shows that dry years represent about 44 to 54 % of the observation period across the basin (Table 3). Two humid phases can be clearly identified. The first spans the 1970s decade, at the beginning of the record, during which positive SPI values dominate across all stations. It is followed by a prolonged dry period from 1980/81 to 2007/08, with negative SPI values prevailing. Although, several isolated wet years are embedded within. A second humid phase is observed from 2008/09 to 2018/19. It is characterized by relatively high humidity levels at its onset, followed by a gradual decrease in positive SPI values over time. Toward the end of the record, this humid phase transitions into a dry period beginning in 2019/20.
|
Table 3. Percentage of Wet and Dry years according to SPI. |
|||||
|
Wet years |
Dry years |
Categories among Dry yr (%) |
|||
|
mild |
moderate |
Severe |
|||
|
S1 |
50.0 |
50.0 |
69.2 |
15.4 |
15.4 |
|
S2 |
53.9 |
46.2 |
58.3 |
37.5 |
4.2 |
|
S3 |
46.2 |
53.9 |
67.9 |
17.9 |
14.3 |
|
S4 |
50.0 |
50.0 |
65.4 |
23.1 |
11.5 |
|
S5 |
50.0 |
50.0 |
65.4 |
15.4 |
19.2 |
|
S6 |
55.8 |
44.2 |
52.2 |
34.8 |
13.0 |
A strong spatial synchrony is observed among the six stations, characterized by the near-simultaneous occurrence of wet and dry years across the basin. Regarding drought severity classes, mild dry conditions clearly dominate across all stations, accounting for more than half of the dry years. Moderately dry conditions show greater spatial variability, representing between 15.4 % (S1&S5) and 37.5 % (S2) of dry years. Severely dry conditions remain comparatively infrequent at all stations but are more pronounced at S5 (19.2 %). No extremely dry conditions (SPI < −2) were recorded at any station over the study period.
3.2.2. Seasonal SPI results
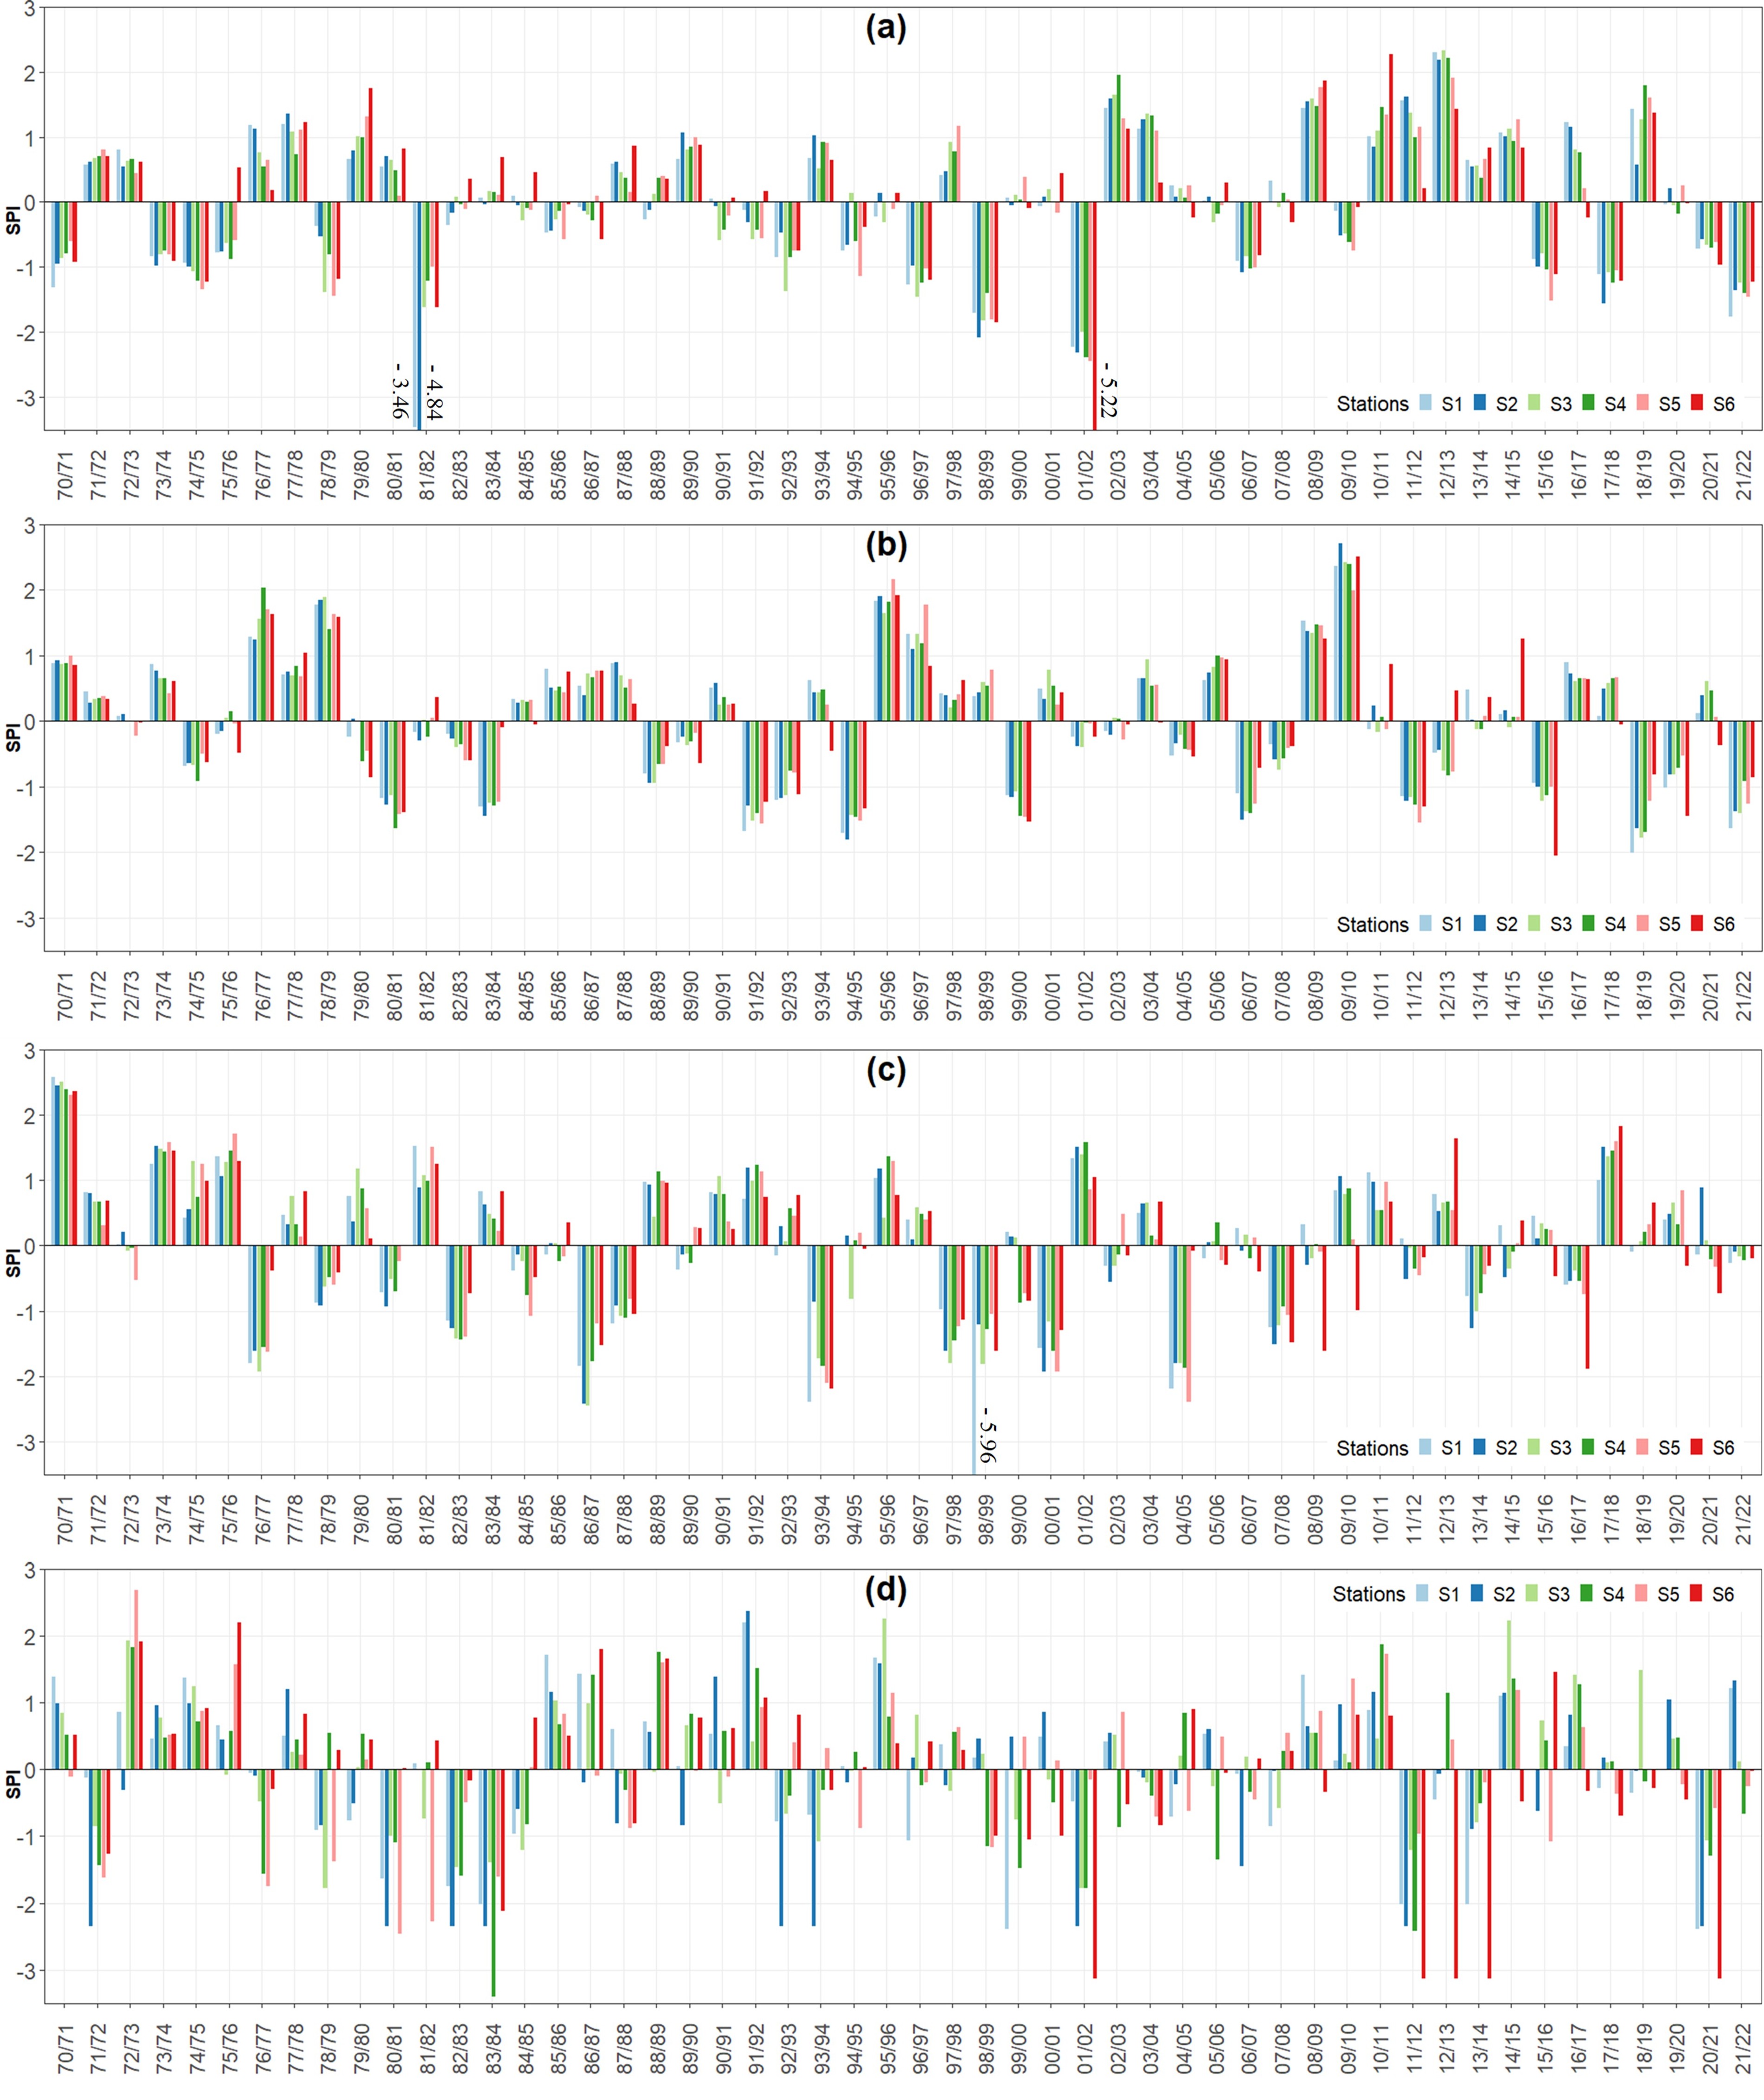
Seasonal SPI results (Figure 6) show values exceeding the critical thresholds of −4 or even −5 sporadically in the spring of 1998/99 (S1) and in the autumns of 1981/82 (S2) and 2001/02 (S6). A persistence and clustering of deficits have been observed recently. These are particularly pronounced during the winter (Figure 6b) and autumn (Figure 6c) of the last years (2018 - 2022). Spring displays the lowest record with an SPI close to −6. The graph in Figure 6d shows that summer is characterized by a very marked contrast in SPI values from one year to the next and from one station to another. This contrast, very evident graphically, is manifested by both the magnitude and the sign of the SPI index.
3.3. Mann-Kendall and Sen’s slope Trend analyses
3.3.1. Annual Rainfall Trend
The Mann-Kendall (MK) test results (Table 4) reveal a consistent decreasing tendency in annual rainfall across all six stations, as indicated by negative Z values. However, this downward trend is statistically significant at the 5 % level only at Tamchachat (S6), with a Z of −2.52 and a p-value of 0.01.
|
Table 4. Mann–Kendall (MK) and Sen’s slope (S) results for annual rainfall (1970–2022). |
||||
|
|
MK (z) |
P-value |
Significance (5%) |
S (mm/y) |
|
S1 |
-1.17 |
0.24 |
- |
-2.38 |
|
S2 |
-0.96 |
0.33 |
- |
-1.49 |
|
S3 |
-1.25 |
0.21 |
- |
-1.74 |
|
S4 |
-0.97 |
0.33 |
- |
-1.86 |
|
S5 |
-1.50 |
0.13 |
- |
-2.62 |
|
S6 |
-2.52 |
0.01 |
+ |
-6.30 |
The magnitude of the detected trends, estimated using Sen’s slope, varies across the basin. Decline rates range from −1.49 to −2.62 mm/yr at five stations, while a markedly stronger decrease is observed at S6, with a Sen’s slope of −6.3 mm/yr.
3.3.2. Seasonal Rainfall Trend
The MK results (Table 5) reveal varying trend directions observed within the same station depending on the season. Overall, a non-significant (p > 0.05) downward trend is observed during winter and spring, although Sen’s slopes are lower in spring. In autumn, a slight, non-significant upward trend is observed for the majority of stations. In summer, the results appear more heterogeneous, with a positive trend at stations S2, S3, and S5 and a negative trend at S1, S4, and S6. However, most summer slopes remain close to zero, indicating non-significant and minor changes. Overall, the observed trends are not statistically significant except at station S6. It exhibits a significant decrease in precipitation in the spring (p = 0.02) and summer (p = 0), with corresponding Sen slopes of −2.4 mm/season and −0.73 mm/season.
|
Table 5. Mann–Kendall and Sen’s slope results for seasonal rainfall trends. |
||||||||||||
|
|
Autumn |
Winter |
Spring |
Summer |
||||||||
|
MK (Z) |
p-value |
Sen |
MK (Z) |
p-value |
Sen |
MK (Z) |
p-value |
Sen |
MK (Z) |
p-value |
Sen |
|
|
S1 |
1.03 |
0.30 |
1.04 |
-1.40 |
0.16 |
-1.90 |
-0.75 |
0.45 |
-0.74 |
-1.16 |
0.25 |
-0.15 |
|
S2 |
0.73 |
0.46 |
0.56 |
-1.32 |
0.19 |
-1.27 |
-0.80 |
0.42 |
-0.76 |
0.88 |
0.38 |
0.09 |
|
S3 |
0.84 |
0.40 |
0.48 |
-1.40 |
0.16 |
-1.35 |
-0.99 |
0.32 |
-0.95 |
0.73 |
0.47 |
0.10 |
|
S4 |
0.49 |
0.62 |
0.37 |
-1.05 |
0.29 |
-1.06 |
-0.91 |
0.36 |
-0.86 |
-0.46 |
0.65 |
-0.09 |
|
S5 |
0.78 |
0.43 |
0.60 |
-1.16 |
0.25 |
-1.24 |
-0.72 |
0.47 |
-0.61 |
0.35 |
0.73 |
0.13 |
|
S6 |
-0.61 |
0.53 |
-0.55 |
-1.05 |
0.29 |
-1.70 |
-2.31 |
0.02 |
-2.40 |
-3.02 |
0.00 |
-0.73 |
3.3.3. Monthly Rainfall Trend
From December to June, a near-generalized downward trend is observed (Table 6). The decrease observed remains statistically insignificant, with a Sen's slope not exceeding −0.60 mm/month at almost all stations. From July to September, there is globally no trend (Sen's slope ≈ 0). However, October and November show a generalized non-significant upward trend, with a slope reaching +0.6 mm/month. Station S6 remains an exception at the basin scale. It shows, relatively, a marked and significant reduction in precipitation, notably in April (Sen's slope = −1.16).
|
Table 6. Results of Mann–Kendall test and Sen’s slope estimates for monthly rainfall. |
|||||||||||
|
MK (Z) |
p-value |
slope |
MK (Z) |
p-value |
slope |
MK (Z) |
p-value |
slope |
|||
|
SEP |
OCT |
NOV |
|||||||||
|
S1 |
0.24 |
0.81 |
0.01 |
0.81 |
0.42 |
0.18 |
1.13 |
0.26 |
0.57 |
||
|
S2 |
0.00 |
1.00 |
0.00 |
0.64 |
0.52 |
0.13 |
0.65 |
0.51 |
0.28 |
||
|
S3 |
-0.01 |
0.99 |
0.00 |
0.64 |
0.52 |
0.15 |
0.99 |
0.32 |
0.39 |
||
|
S4 |
-1.11 |
0.27 |
-0.10 |
0.68 |
0.49 |
0.14 |
0.97 |
0.33 |
0.40 |
||
|
S5 |
-0.64 |
0.52 |
-0.07 |
0.09 |
0.93 |
0.02 |
1.18 |
0.24 |
0.60 |
||
|
S6 |
-1.29 |
0.20 |
-0.17 |
-1.84 |
0.07 |
-0.40 |
0.62 |
0.53 |
0.37 |
||
|
DEC |
JAN |
FEB |
|||||||||
|
S1 |
-0.62 |
0.53 |
-0.32 |
-0.96 |
0.34 |
-0.60 |
-0.68 |
0.49 |
-0.30 |
||
|
S2 |
-0.33 |
0.74 |
-0.15 |
-1.04 |
0.30 |
-0.52 |
-0.49 |
0.62 |
-0.17 |
||
|
S3 |
-0.64 |
0.52 |
-0.28 |
-0.74 |
0.46 |
-0.43 |
-1.21 |
0.23 |
-0.46 |
||
|
S4 |
-0.52 |
0.60 |
-0.25 |
-0.81 |
0.42 |
-0.42 |
-0.91 |
0.37 |
-0.39 |
||
|
S5 |
-0.51 |
0.61 |
-0.30 |
-1.14 |
0.25 |
-0.43 |
-1.00 |
0.32 |
-0.39 |
||
|
S6 |
-0.61 |
0.54 |
-0.44 |
-0.66 |
0.51 |
-0.36 |
-0.65 |
0.51 |
-0.48 |
||
|
MAR |
APR |
MAY |
|||||||||
|
S1 |
-0.44 |
0.66 |
-0.20 |
-0.96 |
0.34 |
-0.38 |
-0.39 |
0.70 |
-0.06 |
||
|
S2 |
-0.29 |
0.77 |
-0.10 |
-0.81 |
0.42 |
-0.45 |
-0.46 |
0.65 |
-0.08 |
||
|
S3 |
-0.31 |
0.76 |
-0.14 |
-1.16 |
0.25 |
-0.45 |
-0.90 |
0.37 |
-0.16 |
||
|
S4 |
-0.15 |
0.88 |
-0.08 |
-0.81 |
0.42 |
-0.41 |
-0.78 |
0.43 |
-0.16 |
||
|
S5 |
-0.10 |
0.92 |
-0.06 |
-0.68 |
0.50 |
-0.31 |
-0.68 |
0.49 |
-0.13 |
||
|
S6 |
-1.15 |
0.25 |
-0.48 |
-2.59 |
0.01 |
-1.16 |
-2.03 |
0.04 |
-0.53 |
||
|
JUN |
JUL |
AUG |
|||||||||
|
S1 |
-2.20 |
0.03 |
-0.08 |
0.09 |
0.93 |
0.00 |
1.04 |
0.30 |
0.00 |
||
|
S2 |
-0.95 |
0.34 |
0.00 |
1.09 |
0.28 |
0.00 |
1.90 |
0.06 |
0.00 |
||
|
S3 |
-2.15 |
0.03 |
-0.13 |
2.15 |
0.03 |
0.00 |
2.12 |
0.03 |
0.08 |
||
|
S4 |
-2.68 |
0.01 |
-0.24 |
1.58 |
0.11 |
0.00 |
2.13 |
0.03 |
0.11 |
||
|
S5 |
-1.82 |
0.07 |
-0.16 |
1.97 |
0.05 |
0.01 |
2.49 |
0.01 |
0.15 |
||
|
S6 |
-3.96 |
0.00 |
-0.60 |
-0.76 |
0.45 |
0.00 |
0.57 |
0.57 |
0.00 |
||
3.4. Innovative Trend Analysis
3.4.1. Annual ITA results
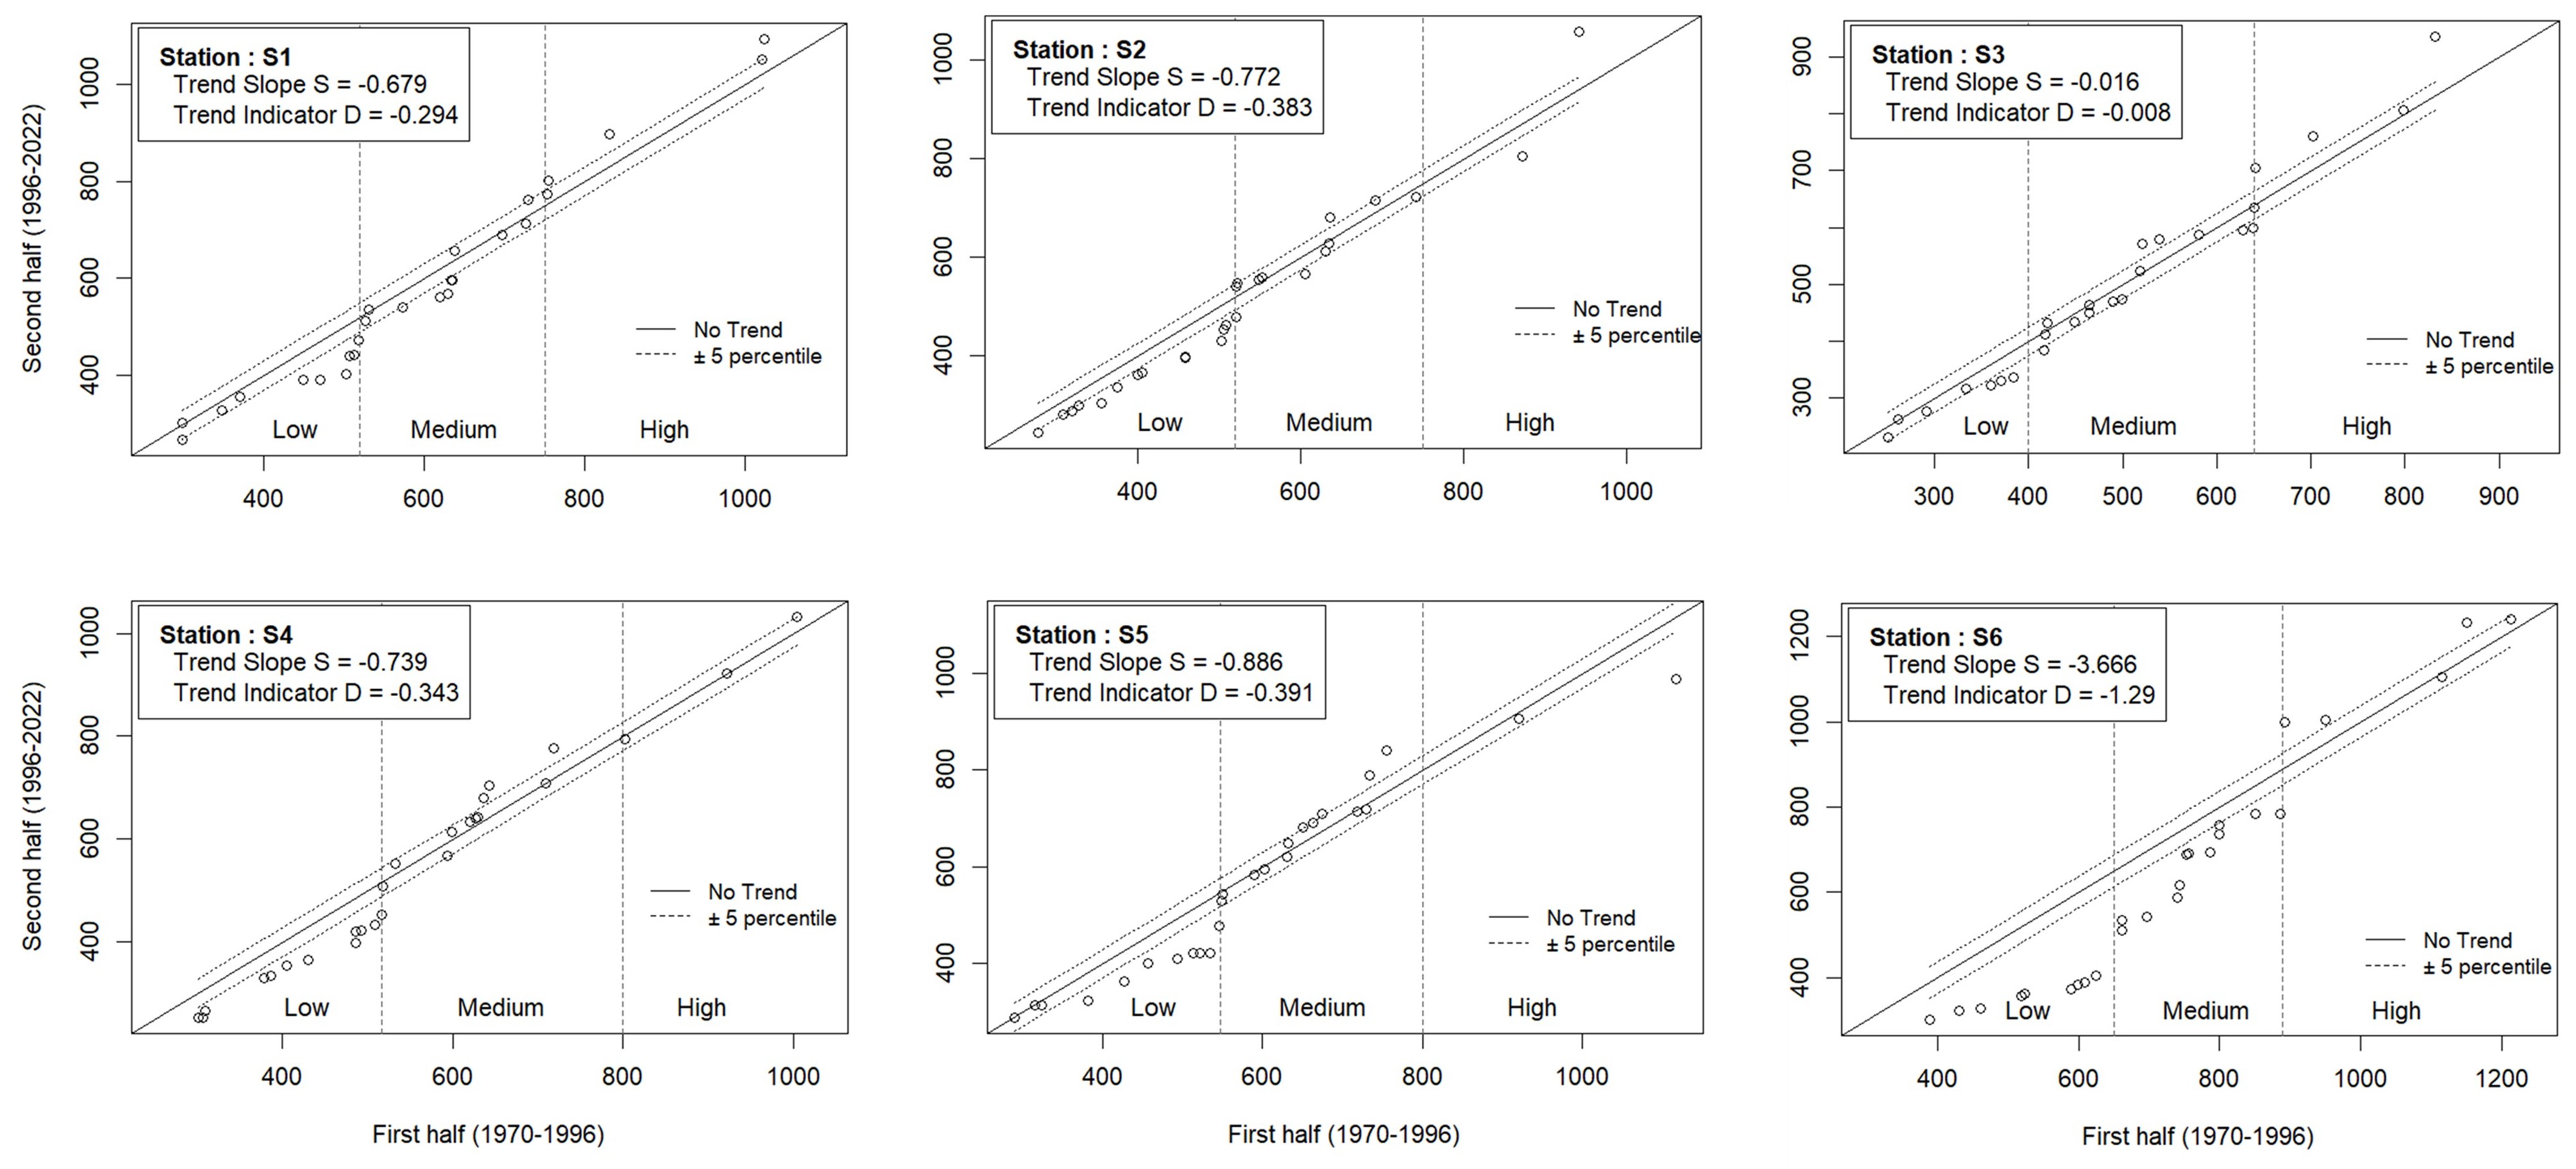
The results of the ITA method show a negative trend in annual precipitation. The trend slope S values are negative in all stations, reaching −3.66 at S6. In contrast, station S3 exhibits a notable stability (S = −0.016; D = −0.008), with data points closely clustered around the 1:1 reference line.
Graphical analysis of scatter plots (Figure 7) reveals contrast within the different categories of values. Indeed, while low values points fall below the 1:1 line, indicating a decreasing trend, high values are frequently positioned above (except at station S5), which signifies an increasing trend. Medium values are stable. Station S6 exhibits a strong decrease in annual precipitation (S = −3.666 and D = −1.29). It affects all rainfall categories low, medium, and high.
3.4.2. Seasonal ITA results
In autumn, despite the decrease in the Low category, an overall positive trend is observed at most stations (Table 7). During winter, although some stations (e.g., S1 and S2) display increasing tendencies in high-intensity precipitation, the general seasonal slopes remain negative, with relatively weak values (from −0.08 to −0.61). Spring rainfall is characterized by a steeper downward trend, with stronger negative slopes (−2.44 at S6). The decrease affects the Medium and mainly the High category. In summer, the total trend is near-stable, with slopes close to zero, despite the relatively pronounced decline in high-intensity events (up to −14.23).
|
Table 7. Seasonal Innovative Trend Analysis (ITA) results as trend slopes at the six stations. |
||||||||||||||||
|
Autumn |
Winter |
Spring |
Summer |
|||||||||||||
|
L |
M |
H |
Total |
L |
M |
H |
Total |
L |
M |
H |
Total |
L |
M |
H |
Total |
|
|
S1 |
-1.57 |
3.21 |
10.92 |
1.54 |
-0.71 |
-3.36 |
10.47 |
-0.61 |
0.02 |
-4.99 |
-26.36 |
-1.22 |
-0.13 |
-1.47 |
-4.78 |
-0.39 |
|
S2 |
-1.47 |
2.68 |
6.19 |
0.82 |
-0.31 |
-1.12 |
25.65 |
-0.35 |
-1.06 |
-2.10 |
-39.38 |
-1.21 |
0.26 |
-0.47 |
-7.34 |
-0.03 |
|
S3 |
-0.54 |
1.85 |
7.14 |
1.31 |
-1.39 |
-0.68 |
2.72 |
-0.33 |
0.10 |
-4.28 |
-45.33 |
-1.01 |
0.19 |
-0.95 |
-1.73 |
0.01 |
|
S4 |
-1.87 |
1.16 |
9.81 |
1.38 |
-0.55 |
-1.03 |
-3.16 |
-0.35 |
0.07 |
-4.43 |
-37.20 |
-1.49 |
-0.25 |
-0.79 |
-2.43 |
-0.28 |
|
S5 |
-1.59 |
3.18 |
8.94 |
1.18 |
-0.85 |
-0.73 |
-7.23 |
-0.41 |
-0.01 |
-2.49 |
-11.93 |
-1.50 |
1.00 |
0.07 |
-4.00 |
-0.16 |
|
S6 |
-3.67 |
-2.10 |
9.38 |
-0.06 |
-0.30 |
-0.12 |
1.40 |
-0.08 |
-3.64 |
-8.42 |
-22.95 |
-2.44 |
-2.36 |
-1.55 |
-14.23 |
-1.09 |
3.4.3. Monthly ITA results
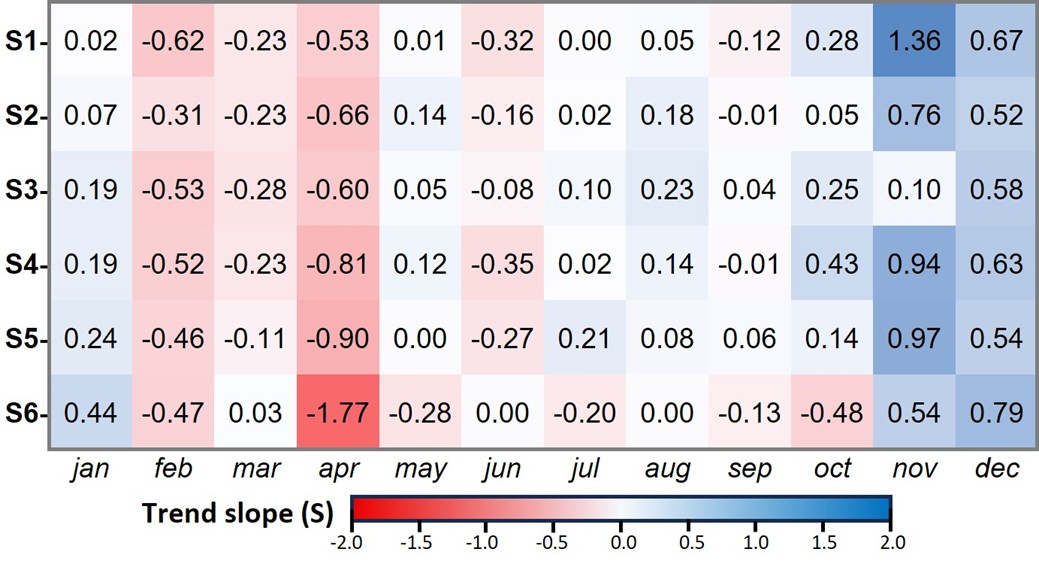
The heatmap (Figure 8) shows a widespread negative trend from February to April. All stations show negative values, with a sharp minimum in April at S6 (S = −1.77). The period from May to October shows weaker and more contrasting trends. Conversely, it become clearly positive in the rest of the months (November to January), particularly in November and December, where all stations exhibit positive slopes, reaching S=1.36 in S1.
4. DISCUSSION
The high rainfall variability evidenced by the results in the study area fits the semi-arid climate of the Mediterranean region in North Africa (Achite et al., 2024; Yavaşlı, 2025). The high coefficient of variation, at both annual and seasonal scales, reflects a structural irregularity rather than an anomaly in the region. This variability is also spatial, manifesting as a gradient between stations depending on altitude. The oscillatory aspect of drought and humid periods identified through the SPI reflects the non-linear rainfall dynamics documented across the Mediterranean region (Singla et al., 2010; Tramblay et al., 2019). It is worth noting that extreme seasonal SPI values falling below −4 or even −5 should not necessarily be interpreted as strict probabilistic rarities under normal distribution assumptions. They reflect an extreme relative moisture deficit that appears in seasons with inherently low precipitation totals and strong variability.
While local variability can be explained by the topographic factor linked to the orography of the basin (Atlas Mountains), the temporal evolution of precipitation suggests the influence of large-scale atmospheric circulation. Similar patterns have been observed in the Middle Atlas and other Moroccan basins (Chaqdid et al., 2023; Driouech, 2010). In particular, phenomena controlling moisture transport toward North Africa, such as the North Atlantic Oscillation (NAO) and the Western Mediterranean Oscillation (WeMO), play a crucial role (Hakam et al., 2025; Mathbout et al., 2020). Positive phases of the NAO are generally associated with decreased precipitation in North Africa (Boughdadi et al., 2023), while negative phases promote increased moisture input (Lamb & Peppler, 1987; Marchane et al., 2016). Similarly, the WeMO has been shown to strongly influence precipitation variability in the western Mediterranean, particularly in autumn and winter (Lopez-Bustins & Lemus-Canovas, 2020). The synchronization of rainfall anomalies between stations also confirms the predominance of regional climatic influences (Driouech, 2010).
The Mann-Kendall test and the ITA confirm a general downward trend in mean annual rainfall, a pattern that Vicente-Serrano et al. (2025) attribute to high interannual variability rather than to a robust long-term trend across the Mediterranean. Through this large-scale spatiotemporal study covering the Mediterranean region, the authors also recognize the possibility of observing trends at the local scale. The more significant decrease observed at the high-altitude station (S6) suggests that mountainous regions may be more sensitive to climate variability (Stefanidis & Chatzichristaki, 2017). This could result from complex interactions between topography and changes in atmospheric circulation patterns (Tramblay et al., 2012). Seasonal analysis reveals that the overall annual trend is related to a downward tendency in winter and spring rainfall. In addition, the observed upward trend in autumn confirms an intra-annual redistribution of precipitation. The results of the study conducted by Kassabi et al. (2022) in the neighboring Sebou basin corroborate our findings.
While the MK and ITA methods show overall agreement in their results, their combination provides a more comprehensive understanding of rainfall dynamics. They cover different aspects of trends. The MK test, by its monotonic nature, treats the time series as a whole and ignores hidden trends within sub-categories, unlike the ITA method, which possesses this capability. Thus, the latter was able to highlight a reduction in low events, with a relative persistence or localized increase in high values. Consequently, rainfall patterns are becoming less predictable (Nadeem et al., 2025). Similar tendencies have been observed in other Mediterranean basins, where precipitation is increasingly erratic and characterized by more pronounced extremes (Bouizrou et al., 2022). Although the ITA method has graphical advantages, it still has certain limitations. The results are sensitive to highly subjective choices, especially for short series with outliers (Nayak & Villarini, 2016); indeed, dividing the time series into two sub-periods and sorting them independently does not allow for the full exploitation of the temporal continuity of the entire series. This approach focuses on changes in the intensity of the values in the two halves without taking into account their exact chronology. The dates associated with the events are lost in this analysis. Furthermore, it is noted in particular that the method is sensitive to the definition of the thresholds for the low, medium, and high categories, which can affect the interpretation, especially in the presence of outliers. Additionally, the absence of p-values associated with the graphical slope constitutes a shortcoming compared to the Mann–Kendall test with regard to the quantification of statistical significance.
The alteration of rainfall patterns directly results in hydrological disturbances. In a semi-arid environment such as the Upper Oum Er-Rbia basin, water resources are highly dependent on seasonal rainfall. Reduced rainfall in winter and spring, key periods for groundwater recharge, affects aquifer renewal, leading to a gradual decline in piezometric levels (Tanarhte et al., 2024). This reduction also affects river flows and, consequently, inflows to dams, compromising water availability for agricultural, domestic, and industrial uses. In the long term, this dynamic exacerbates the imbalance between water supply and demand, increasing the vulnerability of ecosystems. These observations challenge traditional models for mobilizing, planning, and managing water resources. They highlight the need to explicitly integrate climate variability and its associated uncertainties to develop more flexible and integrated management strategies. Such adaptive approaches appear essential to strengthening the resilience of hydrological systems to climate change.
5. CONCLUSION
The results of this work revealed a shift in the precipitation regime over the last five decades in the Upper Oum Er Rbia basin. Indeed, high variability was observed at both spatial and temporal levels. It confirms the fluctuating character of the semi-arid climate in Morocco. Moreover, the basin shows a predominance of prolonged periods of drought, with increased rainfall irregularity. Furthermore, the study highlighted a decrease in annual precipitation, with an intra-annual redistribution. While rainfall increases in autumn, it decreases in winter and spring, which explains the annual trend. The observed changes in precipitation patterns worsen the fragility of water resources in a Mediterranean environment, already characterized by critical climatic conditions. The combination of declining rainfall totals, increased unpredictability, and recurrent droughts directly threatens water supplies and ecosystem stability. These findings highlight the necessity of updating water management strategies to meet climate change challenges and strengthen adaptation measures and resilience.
REFERENCES
- Achite, M., Caloiero, T., Jehanzaib, M., Wałęga, A., Kuriqi, A. & Pellicone, G., 2024. Geo-Statistical Characterization of Annual Maximum Daily Rainfall Variability in Semi-Arid Regions. Atmosphere, 15(12), 1519, https://doi.org/10.3390/ atmos15121519.
- Achite, M., Sankaran, A., Simsek, O., Bouharira, A., Geetha Raveendran Nair, A. N. & Caloiero, T., 2025. Meteorological drought variability and its characterization in sub humid mediterranean region, the Wadi Isser basin of Algeria from 1970 to 2017. Natural Hazards, 121(20), 24101–24126, https://doi.org/10.1007/s11069-025-07693-3.
- Addou, R., Obda, K., Krakauer, N.Y., Hanchane, M., Kessabi, R., El Khazzan, B. & Achir, I. E., 2024. Statistical Analysis for the Detection of Change Points and the Evaluation of Monthly Mean Temperature Trends of the Moulouya Basin (Morocco). Advances in Meteorology, 2024, 1–16, https://doi.org/10.1155/2024/5027669.
- Baycan, A., Sonmez, O. & Tuncer Evcil, G., 2025. Climate Change Effects on Precipitation and Streamflow in the Mediterranean Region. Water, 17(17), 2556, https://doi.org/10.3390/w17172556.
- Belay, A., Demissie, T., Recha, J.W., Oludhe, C., Osano, P.M., Olaka, L.A., Solomon, D. & Berhane, Z., 2021. Analysis of Climate Variability and Trends in Southern Ethiopia. Climate, 9(6), 96, https://doi.org/10.3390/cli9060096.
- Bentayeb, A. & Leclerc, C., 1977. Le causse Moyen atlasique. In Ressources en eau du Maroc: Domaine atlasique et sud-atlasique. Issue 231, pp. 37–66, Service Géologique du Maroc.
- Bonaccorso, B., Cancelliere, A. & Rossi, G., 2015. Probabilistic forecasting of drought class transitions in Sicily (Italy) using Standardized Precipitation Index and North Atlantic Oscillation Index. Journal of Hydrology, 526, 136–150, https://doi.org/ 10.1016/j.jhydrol.2015.01.070.
- Bouchaou, L., Tagma, T., Boutaleb, S., Hssaisoune, M. & El Morjani, Z.E.A., 2011. Climate change and its impacts on groundwater resources in Morocco: The case of the Souss- Massa basin. Climate Change Effects on Groundwater Resources: A Global Synthesis of Findings and Recommendations, August, 129–144, https://doi.org/10.1201/b11611-13.
- Boughdadi, S., Ait Brahim, Y., El Alaoui El Fels, A. & Saidi, M.E., 2023. Rainfall Variability and Teleconnections with Large-Scale Atmospheric Circulation Patterns in West-Central Morocco. Atmosphere, 14(8), 1293, https://doi.org/10.3390/ atmos14081293.
- Boughdadi, S., Saidi, M.E., Ait Brahim, Y., Hakam, O. & Rachdane, M., 2024. Atlantic and Mediterranean-Sourced Precipitation over the Maghreb: Trends and Spatiotemporal Variability. Earth Systems and Environment, 8(3), 765–782, https://doi.org/10.1007/s41748-024-00426-9.
- Bouizrou, I., Aqnouy, M. & Bouadila, A., 2022. Spatio-temporal analysis of trends and variability in precipitation across Morocco: Comparative analysis of recent and old non-parametric methods. Journal of African Earth Sciences, 196, 104691, https://doi.org/10.1016/j.jafrearsci.2022.104691.
- Buyukyildiz, M., 2023. Evaluation of annual total precipitation in the transboundary Euphrates–Tigris River Basin of Türkiye using innovative graphical and statistical trend approaches. Applied Water Science, 13(2), 38, https://doi.org/10.1007/ s13201-022-01845-7.
- Chaqdid, A., Tuel, A., El Fatimy, A. & El Moçayd, N., 2023. Extreme rainfall events in Morocco: Spatial dependence and climate drivers. Weather and Climate Extremes, 40, 100556, https://doi.org/10.1016/j.wace.2023.100556.
- Deitch, M., Sapundjieff, M. & Feirer, S., 2017. Characterizing Precipitation Variability and Trends in the World’s Mediterranean-Climate Areas. Water, 9(4), 259, https://doi.org/10.3390/w9040259.
- Driouech, F., 2010. Distribution des précipitations hivernales sur le Maroc dans le cadre d’un changement climatique: descente d’échelle et incertitudes. In Institut National Polytechnique de Toulouse.
- Driouech, F., Déqué, M. & Mokssit, A., 2009. Numerical simulation of the probability distribution function of precipitation over Morocco. Climate Dynamics, 32(7–8), 1055–1063, https://doi.org/10.1007/ s00382-008-0430-6.
- El Qorchi, F., Yacoubi Khebiza, M., Omondi, O.A., Karmaoui, A., Pham, Q.B. & Acharki, S., 2023. Analyzing Temporal Patterns of Temperature, Precipitation, and Drought Incidents: A Comprehensive Study of Environmental Trends in the Upper Draa Basin, Morocco. Water, 15(22), 3906, https://doi.org/10.3390/w15223906.
- El-Hamdouny, M., El Garouani, M., El-Yazidi, M., Midaoui, A., Goumih, M. & Lahrach, A., 2025. Data Quality Assessment and Homogenization of Rainfall Time Series in Data-Scarce Regions: a Case Study of the Upper Oum Er-Rbia Basin, Northern Morocco. Carpathian Journal of Earth and Environmental Sciences, 20(1), 97–106, https://doi.org/10.26471/cjees/2025/020/317.
- En-Nagre, K., Aqnouy, M., Ouarka, A., Ali Asad Naqvi, S., Bouizrou, I., Eddine Stitou El Messari, J., Tariq, A., Soufan, W., Li, W. & El-Askary, H., 2024. Assessment and prediction of meteorological drought using machine learning algorithms and climate data. Climate Risk Management, 45, 100630, https://doi.org/10.1016/j.crm.2024.100630.
- Filahi, S., Tanarhte, M., Mouhir, L., El Morhit, M. & Tramblay, Y., 2016. Trends in indices of daily temperature and precipitations extremes in Morocco. Theoretical and Applied Climatology, 124(3–4), 959–972, https://doi.org/10.1007/s00704-015-1472-4.
- Ghazi, B., Salehi, H., Przybylak, R. & Pospieszyńska, A., 2025. Assessment of drought conditions under climate change scenarios in Central Europe (Poland) using the standardized precipitation index (SPI). Climate Services, 39, 100591, https://doi.org/10.1016/j.cliser.2025.100591.
- Gilbert, R.O., 1987. Statistical Methods for Environmental Pollution Monitoring. In Van Nostrand Reinhold. Van Nostrand Reinhold.
- Hakam, O., Baali, A., Ait Brahim, Y., El Kamel, T. & Azennoud, K., 2022. Regional and global teleconnections patterns governing rainfall in the Western Mediterranean: case of the Lower Sebou Basin, North-West Morocco. Modeling Earth Systems and Environment, 8(4), 5107–5128, https://doi.org/10.1007/s40808-022-01425-3.
- Hakam, O., Bouras, E.H., Amazirh, A., Ongoma, V., Eddamiri, S., Saidi, L., Zerouali, A. & Chehbouni, A., 2025. Influence of atmospheric and oceanic circulation patterns on precipitation variability in North Africa with a focus on Morocco. Scientific Reports, 15(1), 17977, https://doi.org/ 10.1038/s41598-025-02718-0.
- Hamed, K.H., 2008. Trend detection in hydrologic data: The Mann–Kendall trend test under the scaling hypothesis. Journal of Hydrology, 349(3–4), 350–363, https://doi.org/10.1016/j.jhydrol.2007.11.009.
- Herrera, D.A., Cook, B.I., Fasullo, J., Anchukaitis, K.J., Alessi, M., Martinez, C.J., Evans, C.P., Li, X., Ellis, K.N., Mendez, R., Ault, T., Centella, A., Stephenson, T.S. & Taylor, M.A., 2023. Observed changes in hydroclimate attributed to human forcing. PLOS Climate, 2(11), e0000303, https://doi.org/10.1371/journal.pclm.0000303.
- Jain, V.K., Pandey, R.P., Jain, M.K. & Byun, H.-R., 2015. Comparison of drought indices for appraisal of drought characteristics in the Ken River Basin. Weather and Climate Extremes, 8, 1–11, https://doi.org/10.1016/j.wace.2015.05.002.
- Kendall, M.G., 1975. Rank Correlation Methods (4th ed.). Charles Griffin.
- Kessabi, R., Hanchane, M., Krakauer, N.Y., Aboubi, I., El Kassioui, J. & El Khazzan, B., 2022. Annual, Seasonal, and Monthly Rainfall Trend Analysis through Non-Parametric Tests in the Sebou River Basin (SRB), Northern Morocco. Climate, 10(11), 170, https://doi.org/10.3390/cli10110170.
- Kim, M., Jang, M., Choong, C.E. & Han, J., 2026. Historical and future water quality risks driven by climate change: Strategic management and overcoming challenges. Water Research, 288, 124774, https://doi.org/10.1016/j.watres.2025.124774.
- Kisi, O. & Ay, M., 2014. Comparison of Mann–Kendall and innovative trend method for water quality parameters of the Kizilirmak River, Turkey. Journal of Hydrology, 513, 362–375, https://doi.org/ 10.1016/j.jhydrol.2014.03.005.
- Lamb, P.J. & Peppler, R.A., 1987. North Atlantic Oscillation: Concept and an Application. Bulletin of the American Meteorological Society, 68(10), 1218–1225, https://doi.org/10.1175/1520-0477(1987)068< 1218:NAOCAA>2.0.CO;2.
- Lopez-Bustins, J.A.,& Lemus-Canovas, M., 2020. The influence of the Western Mediterranean Oscillation upon the spatio-temporal variability of precipitation over Catalonia (northeastern of the Iberian Peninsula). Atmospheric Research, 236, 104819, https://doi.org/10.1016/j.atmosres.2019.104819.
- Lu, H., Bryant, R.B., Buda, A.R., Collick, A.S., Folmar, G.J., & Kleinman, P.J.A., 2015. Long-term trends in climate and hydrology in an agricultural, headwater watershed of central Pennsylvania, USA. Journal of Hydrology: Regional Studies, 4, 713–731, https://doi.org/10.1016/j.ejrh.2015.10.004.
- Malik, A., Kumar, A., Guhathakurta, P. & Kisi, O., 2019. Spatial-temporal trend analysis of seasonal and annual rainfall (1966–2015) using innovative trend analysis method with significance test. Arabian Journal of Geosciences, 12(10), 328, https://doi.org/10.1007/s12517-019-4454-5.
- Mann, H.B., 1945. Nonparametric Tests Against Trend. Econometrica, 13(3), 245, https://doi.org/ 10.2307/1907187.
- Marchane, A., Jarlan, L., Boudhar, A., Tramblay, Y. & Hanich, L., 2016. Linkages between snow cover, temperature and rainfall and the North Atlantic Oscillation over Morocco. Climate Research, 69(3), 229–238, https://doi.org/10.3354/cr01409.
- Martin, J., 1981. Le Moyen Atlas central : Étude géomorphologique. In Notes et mémoires du service géologique N° 258 bis (p. 445).
- Mathbout, S., Lopez‐Bustins, J.A., Royé, D., Martin‐Vide, J. & Benhamrouche, A., 2020. Spatiotemporal variability of daily precipitation concentration and its relationship to teleconnection patterns over the Mediterranean during 1975–2015. International Journal of Climatology, 40(3), 1435–1455, https://doi.org/10.1002/joc.6278.
- McKee, T.B., Doesken, NolanJ. & Kleist, J., 1993. The relationship of drought frequency and duration to time scales. Eighth Conference on Applied Climatology, American Meteorological Society, 17–22, 179–184.
- Mekuria, E.T., Demissie, T.A. & Feyessa, F.F., 2025. Investigation of the spatial and temporal long-term hydro-climatic trends in Upper Omo Gibe Basin, Ethiopia. Heliyon, 11(3), e42265, https://doi.org/10.1016/j.heliyon.2025.e42265.
- Mengistu, T.D., Chang, S.W. & Chung, I.-M., 2025. Modeling and prediction of climate change impacts on water resources vulnerability: A multi-model approach. Journal of Environmental Management, 388, 126025, https://doi.org/10.1016/ j.jenvman.2025.126025.
- Midaoui, A., El-Hamdouny, M., Elaloui, A., Karroum, M., Boudhar, A. & Lahrach, A., 2024. Groundwater Potential Assessment in the Upper Oum Er-Rbia Basin, Northern Morocco. Ecological Engineering & Environmental Technology, 25(6), 27–42, https://doi.org/10.12912/27197050/186547.
- Modaresi, F., Danandeh Mehr, A., Bajgiran, I.S. & Safari, M.J.S., 2025. Multi-level trend analysis of extreme climate indices by a novel hybrid method of fuzzy logic and innovative trend analysis. Scientific Reports, 15(1), 27432, https://doi.org/10.1038/ s41598-025-13177-y.
- Nadeem, B., Rahman, A. & Dawood, M., 2025. Modelling rainfall variability, trend and anomaly in Jhelum River basin, western Himalaya. Carpathian Journal of Earth and Environmental Sciences, 20(2), 295–306, https://doi.org/10.26471/cjees/2025/020/334.
- Nayak, M.A. & Villarini, G., 2016. Evaluation of the capability of the Lombard test in detecting abrupt changes in variance. Journal of Hydrology, 534, 451–465, https://doi.org/10.1016/j.jhydrol.2016.01.016.
- Nikolova, N., Radeva, K., Matev, S. & Gera, M., 2026. Observed Change in Precipitation and Extreme Precipitation Months in the High Mountain Regions of Bulgaria. Atmosphere, 17(1), 93, https://doi.org/10.3390/atmos17010093.
- Nistor, M.-M. & Man, T.C., 2019. Water availabilyt variation under climate change in Turkey during 21st century. Carpathian Journal of Earth and Environmental Sciences, 14(1), 19–28, https://doi.org/10.26471/cjees/2019/014/054.
- OMM., 2012. Guide d’utilisation de l’indice de précipitations normalisé. Temps. Climat. Eau, 1090, 17.
- OMM & GWP., 2016. Manuel des indicateurs et indices de sécheresse (Issue 1173). Organisation Météorologique Mondiale et Global Water Partnership.
- Orke, Y.A. & Li, M.-H., 2021. Hydroclimatic Variability in the Bilate Watershed, Ethiopia. Climate, 9(6), 98, https://doi.org/10.3390/cli9060098.
- Ouatiki, H., Boudhar, A., Ouhinou, A., Arioua, A., Hssaisoune, M., Bouamri, H. & Benabdelouahab, T., 2019. Trend analysis of rainfall and drought over the Oum Er-Rbia River Basin in Morocco during 1970–2010. Arabian Journal of Geosciences, 12(4), https://doi.org/10.1007/s12517-019-4300-9.
- Öztopal, A. & Şen, Z., 2017. Innovative Trend Methodology Applications to Precipitation Records in Turkey. Water Resources Management, 31(3), 727–737, https://doi.org/10.1007/s11269-016-1343-5.
- Park, J., Lim, Y.-J., Kim, B.-J. & Sung, J.H., 2018. Appraisal of Drought Characteristics of Representative Drought Indices using Meteorological Variables. KSCE Journal of Civil Engineering, 22(5), 2002–2009, https://doi.org/ 10.1007/s12205-017-1744-x.
- Pawar, U., Karunathilaka, P. & Rathnayake, U., 2022. Spatio-Temporal Rainfall Variability and Concentration over Sri Lanka. Advances in Meteorology, 2022, 1–14, https://doi.org/ 10.1155/2022/6456761.
- Polychroni, I.D., Nastos, P.T., Hatzaki, M. & Kapsomenakis, J., 2026. Compound extremes of air temperature and precipitation over the Mediterranean region. Understanding the influence of atmospheric circulation. Atmospheric Research, 330, 108529, https://doi.org/10.1016/ j.atmosres.2025.108529.
- Raymond, F., Ullmann, A. & Camberlin, P., 2016. Intense rainfalls in the Mediterranean Basin: Which trends between 1950 and 2013? Cybergeo, https://doi.org/10.4000/cybergeo.27410.
- Salhi, A., Martin-Vide, J., Benhamrouche, A., Benabdelouahab, S., Himi, M., Benabdelouahab, T. & Casas Ponsati, A., 2019. Rainfall distribution and trends of the daily precipitation concentration index in northern Morocco: a need for an adaptive environmental policy. SN Applied Sciences, 1(3), 277, https://doi.org/10.1007/s42452-019-0290-1.
- Sen, P. K., 1968. Estimates of the Regression Coefficient Based on Kendall’s Tau. Journal of the American Statistical Association, 63(324), 1379–1389, https://doi.org/10.1080/01621459.1968.10480934.
- Şen, Z., 2012. Innovative Trend Analysis Methodology. Journal of Hydrologic Engineering, 17(9), 1042–1046, https://doi.org/10.1061/(ASCE)HE.1943-5584.0000556.
- Şen, Z., 2014. Trend Identification Simulation and Application. Journal of Hydrologic Engineering, 19(3), 635–642, https://doi.org/10.1061/ (ASCE)HE.1943-5584.0000811.
- Şen, Z., 2017. Innovative trend significance test and applications. Theoretical and Applied Climatology, 127(3–4), 939–947, https://doi.org/10.1007/ s00704-015-1681-x.
- Serinaldi, F., Chebana, F. & Kilsby, C.G., 2020. Dissecting innovative trend analysis. Stochastic Environmental Research and Risk Assessment, 34(5), 733–754, https://doi.org/10.1007/s00477-020-01797-x.
- Singla, S., Mahé, G., Dieulin, C., Driouech, F., Milano, M., El Guelai, F.Z. & Ardoin-Bardin, S., 2010. Evolution des relations pluie-débit sur des bassins versants du Maroc. IAHS-AISH Publication, 340(October), 679–687.
- Stefanidis, S. & Chatzichristaki, C., 2017. Response of soil erosion in a mountainous catchment to temperature and precipitation trends. In Carpathian Journal of Earth and Environmental Sciences, Vol. 12, Issue 1.
- Stewart, I.T., Baez Morales, A., Maurer, E.P., Li, Q., Díaz, R.S., Guingona, B. & Torres Torres Landa, A., 2026. Challenges and opportunities in building community-driven adaptive capacity under climate change for smallholder farmers in the Global South. International Journal of Climate Change Strategies and Management, 18(1), 20–41, https://doi.org/10.1108/IJCCSM-08-2025-0258.
- Stricevic, R., Djurovic, N. & Djurovic, Z., 2011. Drought classification in Northern Serbia based on SPI and statistical pattern recognition. Meteorological Applications, 18(1), 60–69, https://doi.org/ 10.1002/met.207.
- Sun, F., Roderick, M.L. & Farquhar, G.D., 2018. Rainfall statistics, stationarity, and climate change. Proceedings of the National Academy of Sciences, 115(10), 2305–2310, https://doi.org/ 10.1073/pnas.1705349115.
- Tahiri, A., Amraoui, F., Sinan, M., Bouchaou, L., Berrada, F. & Benjmel, K., 2022. Influence of climate variability on water resource availability in the upper basin of Oum-Er-Rabiaa, Morocco. Groundwater for Sustainable Development, 19 September 2020, 100814, https://doi.org/10.1016/ j.gsd.2022.100814.
- Tanarhte, M., De Vries, A.J., Zittis, G. & Chfadi, T., 2024. Severe droughts in North Africa: A review of drivers, impacts and management. Earth-Science Reviews, 250, 104701, https://doi.org/10.1016 /j.earscirev.2024.104701.
- Tercini, J.R.B., Perez, R.F., Schardong, A. & Bonnecarrère, J.I.G., 2021. Potential Impact of Climate Change Analysis on the Management of Water Resources under Stressed Quantity and Quality Scenarios. Water, 13(21), 2984, https://doi.org/10.3390/w13212984.
- Tramblay, Y., Badi, W., Driouech, F., El Adlouni, S., Neppel, L. & Servat, E., 2012. Climate change impacts on extreme precipitation in Morocco. Global and Planetary Change, 82–83, 104–114, https://doi.org/10.1016/j.gloplacha.2011.12.002.
- Tramblay, Y., El Adlouni, S. & Servat, E., 2013. Trends and variability in extreme precipitation indices over Maghreb countries. Natural Hazards and Earth System Sciences, 13(12), 3235–3248, https://doi.org/10.5194/nhess-13-3235-2013.
- Tramblay, Y., Mimeau, L., Neppel, L., Vinet, F. & Sauquet, E., 2019. Detection and attribution of flood trends in Mediterranean basins. Hydrology and Earth System Sciences, 23(11), 4419–4431, https://doi.org/10.5194/hess-23-4419-2019.
- Tri, D.Q., Dat, T.T. & Truong, D. D. , 2019. Application of meteorological and hydrological drought indices to establish drought classification maps of the Ba River basin in Vietnam. Hydrology, 6(2), https://doi.org/10.3390/hydrology6020049.
- Valdes-Abellan, J., Pardo, M.A. & Tenza-Abril, A.J., 2017. Observed precipitation trend changes in the western Mediterranean region. International Journal of Climatology, 37, 1285–1296, https://doi.org/10.1002/joc.4984.
- Vicente-Serrano, S.M., Tramblay, Y., Reig, F., González-Hidalgo, J.C., Beguería, S., Brunetti, M., Kalin, K.C., Patalen, L., Kržič, A., Lionello, P., Lima, M.M., Trigo, R.M., El-Kenawy, A.M., Eddenjal, A., Türkes, M., Koutroulis, A., Manara, V., Maugeri, M., Badi, W., … Potopová, V., 2025. High temporal variability not trend dominates Mediterranean precipitation. Nature, 639(8055), 658–666, https://doi.org/10.1038 /s41586-024-08576-6.
- Wu, H. & Qian, H., 2017. Innovative trend analysis of annual and seasonal rainfall and extreme values in Shaanxi, China, since the 1950s. International Journal of Climatology, 37(5), 2582–2592, https://doi.org/10.1002/joc.4866.
- Yavaşlı, D.D., 2025. Spatio‐Temporal Trends in Precipitation Indices Over Mediterranean Using ERA5‐Land Data (1950–2024). International Journal of Climatology, 45(13), https://doi.org/10.1002/joc.70049.
- Yue, S. & Wang, C., 2004. The Mann-Kendall Test Modified by Effective Sample Size to Detect Trend in Serially Correlated Hydrological Series. Water Resources Management, 18(3), 201–218, https://doi.org/10.1023/B:WARM.0000043140.61082.60.
- Zhang, X., Harvey, K.D., Hogg, W.D. & Yuzyk, T.R., 2001. Trends in Canadian streamflow. Water Resources Research, 37(4), 987–998, https://doi.org/10.1029/2000WR900357.
- Zian, A., Benaabidate, L., Haboubi, K., Mliyeh, M.M. & Milewski, A., 2024. Assessment of the severity of meteorological drought in the region of Al Hoceima, Morocco, using precipitation trends and the SPI. Carpathian Journal of Earth and Environmental Sciences, 19(2), 387–400, https://doi.org/10.26471/cjees/2024/019/307.