1. INTRODUCTION
Water is an essential element for life on Earth and the most abundant substance. Most of the Earth's surface (71%) is covered by water, also known as the World Ocean, which is the sum of all oceans and seas. On land, water is in a liquid state in streams, rivers, lakes, wetlands, and in a solid state as glaciers and snow. A total of 96.54% of the total water quantity (fresh + salt water) is in the World Ocean (Radevski, 2021), while the remaining 3.5% is freshwater, mainly stored in glaciers, ice caps, and groundwater. Freshwater available for drinking and use represents only a small part of the total quantity. Water plays a key role in the climate system, ecosystems, and the daily life of living beings. Its uneven distribution poses a significant challenge for many regions around the world. The most common representation of water on land is through the appearance of rivers. A river is a water mass that moves through a bed - a depression cut into the land (Vasileski, 2004). Each river is characterized by its specific river flow, its dimensions, and phenomena, which affect the surrounding space. Since rivers are spatially connected systems, they form connections in a series of spatial and temporal scales (Fryirs & Brierley, 2013). The water in a river is usually confined to a channel through which it moves downstream from the source to the place where it flows. Rivers shape the landscape through which they flow by eroding rocks and sedimentary material. Downstream at lower places, which leads to a change in the morphology of the river bed (Walther, 2014). As a result of these changes, the river bed meanders.
River meandering, with its curved paths, has long fascinated scientists because its specific characteristics significantly impact ecosystems and geographical space. Meandering is a prominent feature of rivers in flat areas, where, under the influence of water mass inertia and lateral erosion, more pronounced bends, known as meanders (Vasileski, 2004), are formed. Meanders act as natural deposition zones for sediments, influencing both sediment deposition and erosion, which subsequently shape the river's morphology and the adjacent ecosystems. The riverbed contains numerous larger sediments, such as gravel, coarse sand, and stones, deposited in the lower reaches due to fluvial erosion (Crossato, 2008). In areas with flatter valley slopes (less than 4%), rivers typically develop wide courses with water flowing through several interconnected channels (multiple strands) within the banks of a wider channel (Crossato, 2008). Over time, there is a gradual accumulation of alluvial sedimentary material in the corridor, with old meanders gradually filling with sedimentary deposits (Fryirs & Brierley, 2013). However, other factors additionally influence the meandering process, predominantly natural factors, but in recent years, also anthropogenic factors (Morais et al., 2016). Furthermore, meandering river courses are of great importance for studying floodplain dynamics and assessing flood risk (Raj et al., 2015). Additionally, meandering rivers are very sensitive to environmental changes, including human activities such as riverbed channelization and changes in surrounding land use. Among the first and most important fluvial studies of the meandering process were those (Thomson, 1876), who began to study the regularities of meandering, as well as (Leopold & Wolman, 1957, 1960).
Recent research in the latter half of the 20th and the beginning of the 21st century increasingly and intensively utilizes new technologies in scientific analysis and research. Examples of these technologies include Geographic Information Systems (GIS) and Remote Sensing, which have been applied to the study of in the evolution of meandering (Mithun et al., 2012), (Yang et al., 1999), (Yang et al., 2015), (Kummu et al., 2008), (Butnariu et al., 2016), morphodynamics (Basnayaka, et al., 2022), (Bag et al., 2019), spatiotemporal variations in the change of the river bed during the meandering of the river (Morais et al., 2016), study of the dynamics of floodplains plains and flood risk assessment (Raj et al., 2015), as well as mapping the depth of river flows based on freely commercially available aerial photographs (Legleiter, 2013), (Langović, 2020), (Butnariu et al., 2016). Furthermore, an assessment of the resolution of photogrammetric images on the characterization of river flow hydromorphology has been conducted (Casado et al., 2016). The application of GIS as a leading trend and technology in geographical research offers enhanced insight and monitoring capabilities for these hydrological processes, driven by the necessity for continuous monitoring of changes within geographical space. This study aims to analyses and compare hydromorphological changes in two selected meander sections of the largest river Vardar and the second largest river Bregalnica, which is also the largest left tributary to Vardar in North Macedonia, by applying GIS based approach. The main research questions are focused on identifying the rate and spatial patterns of the channel changes, as well as evaluating the difference in lateral migration, bankline shifts, planimetric parameters and meander dynamic between these selected sections. The comparative framework applied to both rivers, is based on using the same GIS methodology, which allow us to create a detailed assessment of their morphodynamic changes, and identification of similarities and differences between the two selected sections under different local geographical conditions. The scientific and practical significance of the comparison is for a better understanding of the fluvial processes in North Macedonia, because it can provide a useful basis for river management, hazard mitigation and long-term morphological monitoring, especially for the river Vardar, because intensive agricultural activities and road infrastructure near the river.
2. MATERIALS AND METHODS
2.1. Study Area
The selected section of the Bregalnica River is located in the central part of the Republic of North Macedonia in the area of the Tikvesh Valley, while the selected section of the Vardar River is located in the southeastern part of the country, in the area of the Gevgelija-Valandovo Valley (Figure 1). The Tikvesh Valley covers an area of 2518 km2, has an elongated shape with a length of 50 km, and a width of 40 km. Within the territory of the valley, the Bregalnica River flows into the Vardar near the village of Vinichani.
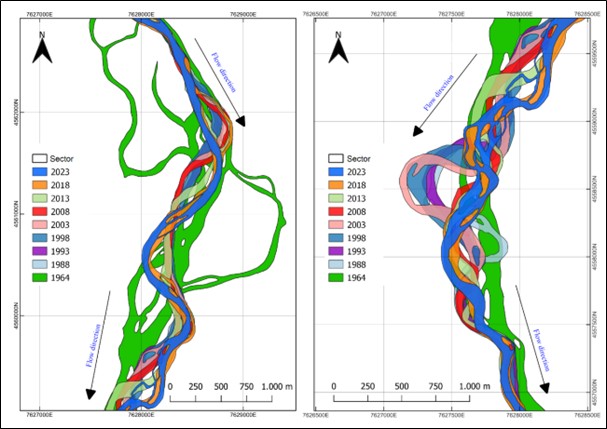
The selected section of the Vardar River is located in the southern part of the Gevgelija-Valandovo basin, representing a morphostructure of subsidence with a total area of 1,000 km2. The basin is characterized by a meridional direction of extension with a length of 30 km, while the width of the flat area is from 6 to 8 km. In terms of its origin, it is a tectonic basin, lowered along fault lines where several thermomineral springs occur (Stojmilov, 2003). The Vardar River is the largest and longest river in the Republic of North Macedonia. It rises near the village of Vrutok at 693 m above sea level and flows into the Aegean Sea in the Gulf of Thessaloniki.
The total length of the Vardar is 388 km, of which 301 km is in the territory of North Macedonia. The size of the drainage basin is 20,535 km2. The Bregalnica River is the second longest river in the Republic of North Macedonia, largest left tributary of the Vardar River. It rises near the Bulgarian border, east of Berovo, under the Chengino Kale peak at 1720 m a.s.l. with a total length of 225 km. It flows through the area of Malesh and Pijanec (the towns of Berovo and Delchevo), Kochanskoto Pole, Shtip, Ovche Pole (Slandol), and near Gradsko, it flows into the Vardar at an elevation of 137 m. a.s.l. (Gashevski, 1979). The selected section of the Bregalnica River meandering covers the final lower course of the Bregalnica River, 4 km from the confluence between Bregalnica and Vardar River. It is important to say that a main geographical characteristic of North Macedonia is a country with around 80% hilly mountain surface (Manevska, 2025). So the selected meanders section are in the lower walley part of the country.
Bregalnica Section is characterized by a width of 5,952 m and a length of 9,675 m and an area of 57.58 km2. The elevation of the river course at the beginning of the studied section is 186 m above sea level, while the elevation at the exit of the studied section is 147 m above sea level (Google Earth Pro), which leads us to the record that the Bregalnica River has a height drop of 39 meters. The selected section of the meandering of the Vardar River covers the lower reaches of the Vardar River, in the southernmost parts of the Gevgelija-Valandovo Valley, from the village of Prdjeci, all the way to the Macedonian-Greek border. Vardar Section is characterized by a width of 7,856 m and a length of 9,126 m and a total area of 71.69 km2. The elevation of the river inlet at the beginning of the studied section is 53 m above sea level, while the elevation at the exit of the studied section is 44 m above sea level (Google Earth Pro), which leads to the calculation that the Vardar River has a height drop of 9 meters.
2.2. Data and methods
Data collection is an important process that involves considerable time in the work (Gorin, 2021), where the main strength of a functional GIS is the data. For the aim of the research, data for 59 years (from 1964 to 2023) for the meandering of the Bregalnica and the most prominent meandering section of the Vardar River were downloaded and processed. The data include topographic maps with a scale of 1:50000, then geological maps with a scale of 1:100000, satellite images from the Landsat series for the period from 1983 to 2013, satellite images from the Sentinel series for the period from 2018 to 2023, as well as hydrological yearbooks. Thus, 8 series of satellite images were used over several years, where for the first three examined periods from 1988 to 1998, Landsat-5 TM was used, while for the fourth (2003) and fifth (2008) examined periods, satellite images from the Landsat-7 ETM+ series were used (USGS, 2024) and for the last two five-year examined periods (2018 and 2023), satellite images from the Sentinel-2A and Sentinel-2B missions were used (Copernicus, 2024). Satellite images from the Sentinel series have 13 different multispectral channels with different high spatial resolutions of 10 m, 20m, and 60 m, with a constant and frequent orbital period over the recorded location of 10 days. (Table 1 and Table 2). From the analog data, topographic maps with a scale of 1:50000 produced by the VGI Belgrade, and geological maps with a scale of 1:100000 produced by the Federal Geological Survey in Skopje were used.
Analog data sources (topographic and geological maps) were scanned with a resolution of 300 DPI, in order to preserve the quality of the contents in electronic raster form. Topographic map with a scale 1:50000 Titov Veles sheet 732-4 has been used for Bregalnica, while for Vardar is topographic map scale 1:50000 Demir Kapija sheet 784-4. From the geological aspect, the following geological maps were used OGK Prilep Sheet K34-80 for Bregalnica river and OGK Gevgelija Sheet K34-106 for Vardar River. Also, for the interpretation of the geological composition, geological map interpreters OGK List Titov Veles K34-80 and OGK List Gevgelija K34-106 were used (Ivanovski, 1970; Karajovanović & Hadžimitrova, 1982). The next step in the processing of the topographic maps included their georeferencing and transformation to the Macedonia State Coordinate System zone 7, code EPSG_6316 (AKN, 2024). The satellite images were imported into the ArcMap 10.8 software package and rectified. The 30-meter resolution bands were then connected to the 15-meter panchromatic band to obtain a new composite image with a higher spatial resolution of 15 m. Then, the part of the resulting composite satellite image that is of interest to us for study was extracted, i.e., "cut," using a vector polygon called the "Area of Interest". The next step in the processing of digital images is radiometric and atmospheric correction. Radiometric correction is used to convert the digital number of the satellite image (DN) into spectral radiance (at the sensor) and reflectance. This process is a prerequisite for atmospheric correction, which aims to remove or minimize atmospheric effects such as absorption and scattering (Suyarso et al, 2023). This was followed by testing and selecting the most appropriate spectral bands to best enable the reclassification of satellite images and the optimal recording of water surfaces.
For the Landsat 4 MSS/TM and Landsat 7 ETM+ series, the 4-3-2 spectral band combination was selected, while for the more recent Landsat-8 OLI satellite image series, the 5-4-3 spectral band combination was used. These spectral band combinations are also known as near-infrared composite images. For the Sentinel-2 satellite image series, the 8-4-3 spectral band combination was used. The NDWI (Normal Difference Water Index) was also applied. This index uses the green and near-infrared spectral bands, which are suitable for identifying water surfaces in the surrounding space. To maintain methodological consistency in the work, manual digitization of the riverbank boundary on the screen of each composite satellite image was performed, at a minimum digitization scale of 1:5000 at the zoom level of the 30-meter images, up to 1:2000 for the satellite images of the 10-meter Sentinel images. The accuracy and precision are higher than with the automatic vectorization method (Machala et al., 2015) for smaller rivers compared to bigger rivers.
Table 1. Data for Landsat series of satellite images.
|
Year |
Satellite |
Sensor |
Resolution (m) |
Path |
Row |
Projection/ Datum |
|
1988 |
Landsat 5 |
TM |
30 |
184 |
31 |
UTM / WGS-84 |
|
1993 |
Landsat 5 |
TM |
30 (120) |
184 |
31 |
UTM / WGS-84 |
|
1998 |
Landsat 5 |
TM |
30 (120) |
184 |
31 |
UTM / WGS-84 |
|
2003 |
Landsat 7 |
ETM+ |
30 (15) |
184 |
31 |
UTM / WGS-84 |
|
2008 |
Landsat 7 |
ETM+ |
30 (15) |
184 |
31 |
UTM / WGS-84 |
|
2013 |
Landsat 8 |
OLI/TIRS |
30 (15) |
184 |
31 |
UTM / WGS-84 |
Table 2. Data for Sentinel series of satellite images.
|
Year |
Satellite |
Level correction |
Resolution |
Orbit number |
Orbit direction |
Projection/ Datum |
|
2018 |
Sentinel-2B |
L1C |
10 (20,60) |
93 |
Descending |
UTM / WGS-84 |
|
2018 |
Sentinel-2B |
L1C |
10 (20,60) |
93 |
Descending |
UTM / WGS-84 |
|
2018 |
Sentinel-2A |
L2A |
10 (20,60) |
93 |
Descending |
UTM / WGS-84 |
|
2023 |
Sentinel-2B |
L2A |
10 (20,60) |
93 |
Descending |
UTM / WGS-84 |
|
2023 |
Sentinel-2B |
L2A |
10 (20,60) |
93 |
Descending |
UTM / WGS-84 |
|
2023 |
Sentinel-2B |
L2A |
10 (20,60) |
136 |
Descending |
UTM / WGS-84 |
3. RESULTS
3.1. Sinusoidality
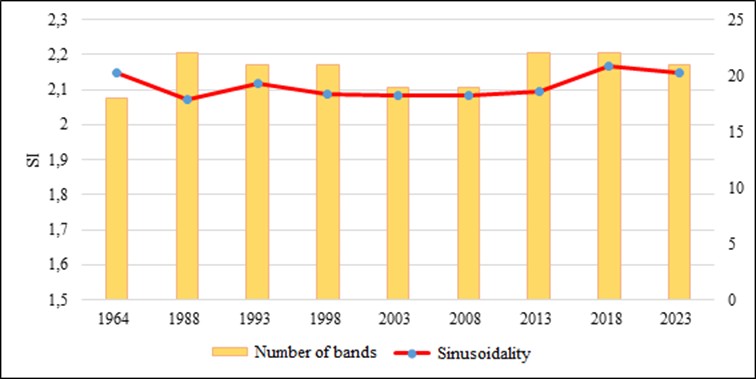
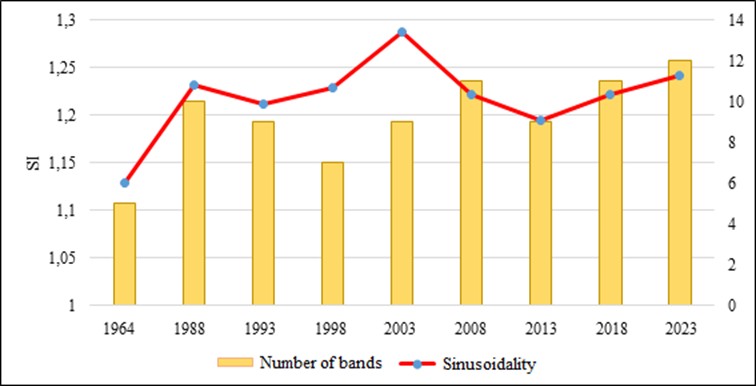
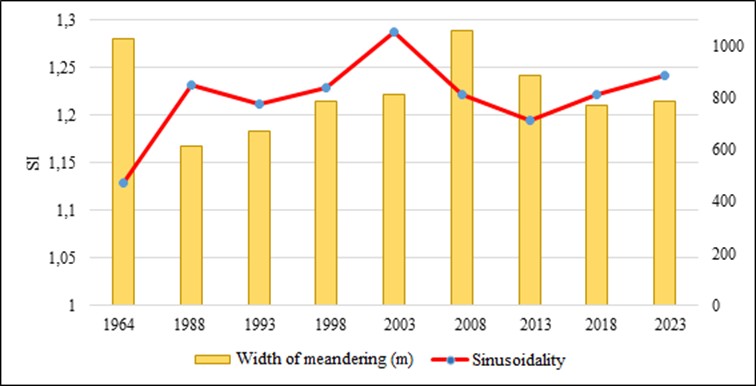
Based on the analyzed data, the regularity of the sinusoidality and the number of bends in the selected section vary over the years, i.e., from 1964 to 2023, a trend of continuous increase in sinusoidality is recorded in this part of Bregalnica. The lowest sinusoidality value of 2.073 was measured here in 1988, while the highest value is 2.168 and was measured in 2018. The number of bends also remains relatively stable, with about 20 bends throughout the entire meandering section (Figure 2). For Vardar, the sinusoidality during the examined period varies over the years. At the beginning of the examined period, the sinusoidality coefficient is 1.128 and increases until 2003, when it is 1.287 and represents the highest value in the entire examined period.
Then, a decrease in the coefficient is observed until 2013, when it has a value of 1.195 and then a small increase is observed again, when in 2023 it has the lowest value of 1.241. In terms of the number of bends (bends) of meandering, it differs. In 1964, the smallest number of bends (5 bends) was registered, while in 2023 the largest number of bends was registered, a total of 12 (Figure 3).
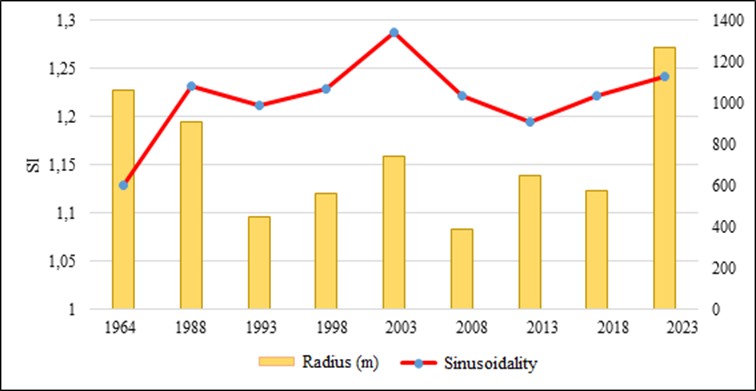
3.2. Radius of curvature
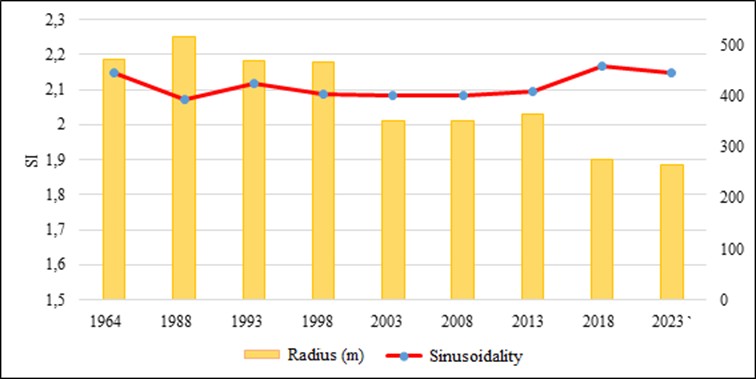
The radius of curvature is a measure of the "tightness" of a meander curve and is inversely proportional to the sinusoidality (Bag et al., 2019). It can be concluded that from the maximum values, the smallest radius of curvature (curvature) was measured in 2023, with a value of 266 m, while the largest value was measured in 1988 at 517 m. Between 1964 and 1988, there was a slight increase, and the radius of curvature and decrease in sinusoidality are due to the floods that affected the country in 1979, 1985, and 1986 as can be seen in Figure 4. The radius of curvature in the examined section of the Vardar River has undergone major changes. Thus, the largest maximum radius of curvature was measured in 2023 and was 1269 m, while the smallest maximum radius of curvature was measured in 2008 and was 387 m. From 1963 to 1993, a decrease in the radius was recorded, and in 2003, we had a new increase in the radius of curvature. In 2008, we had a decrease again. From 2008 until the last analyzed year 2023, there was a new large increase in the radius, as can be seen in Figure 5.
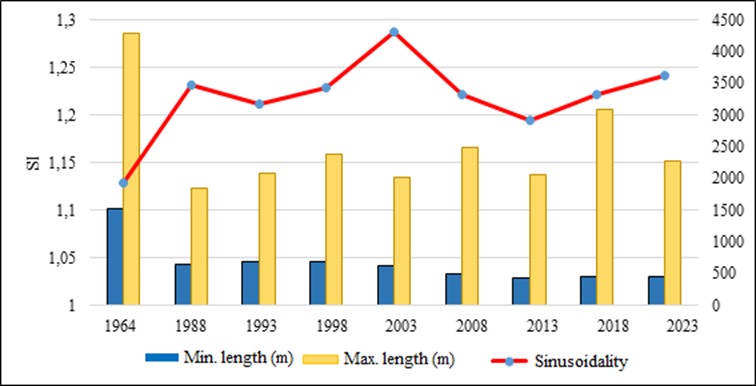
3.3. Maximum and minimum meandering length
Regarding the maximum and minimum meandering length in the Bregalnica River section. Regarding the minimum lengths, the lowest value was measured in 1964, and it was 149 m, while the highest minimum value was measured in 2003, which was 717 m. In the section with the maximum measured lengths, the lowest maximum length was 1551 m for 1988, while the highest maximum meandering length was measured in 2013 and it was 2386 m, shown in Figure 6. The maximum and minimum meandering lengths of the Vardar also change throughout the studied period. The absolute lowest length was measured in 2013 and was 427 m, while the absolute highest length was measured in 1964 and was 4294 m. According to the measured data, the minimum and maximum meandering lengths are not mutually related to the sinusoidality of the Vardar River. Also, in 1988, a large drop in the maximum length from 4294 m to 1849 m was registered over 24 years, shown in Figure 7.
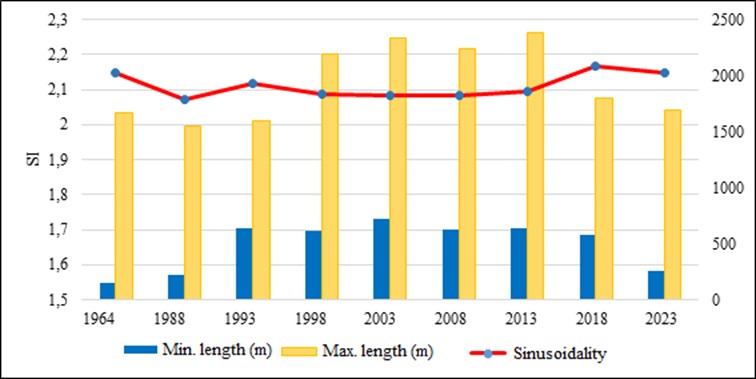
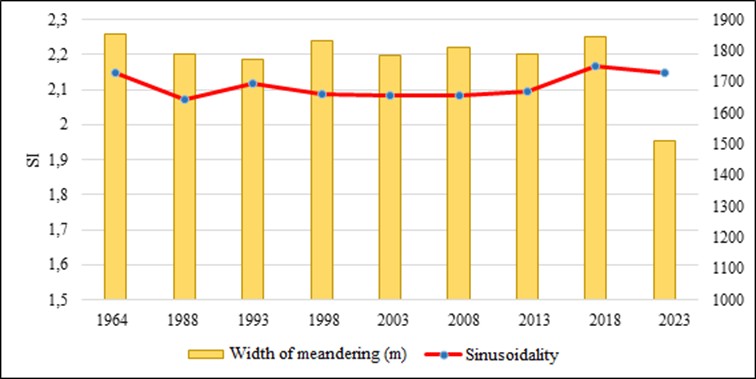
3.4. Maximum width of meandering
Regarding the maximum meandering width of the bends in the studied section of Bregalnica, it can be noted that during the entire examined period, there are no significant changes in the maximum amplitude, which ranges from 1853 m in 1964 to 1845 m in 2023, i.e., stabilization of the meandering width prevails. In Figure 8, we can see a significant deviation occurs in 2023, where the maximum amplitude is reduced to 1511 m, i.e., a drop of 334 m, although the number of bends in the previously examined period of 2018 has decreased by ne meander bend. The maximum width of the Vardar meander is also characterized by significant changes. The largest measured width of the meander was recorded in 2008, where the maximum width was 1060 m, while the smallest maximum amplitude was measured in 1988 and was 616 m. From the beginning of the research period until 1988, a decrease in the amplitude by 413 meters (40.13% compared to 1964) was recorded. Then, from 1988 until 2008, a continuous increase of 444 m was recorded, i.e., an increase of 72.07%. In 2013, a decrease in the amplitude was recorded, followed by a new increase in the amplitude towards 2023, shown in Figure 9.
3.5. Migration of river bend
The migration of the river bed, i.e., the change of the river bank, occurs on both river banks of the river, which are included in the meandering process. The migration of the river bed is caused by the processes of erosion and accumulation of the riverbanks, which accordingly leads to the retreat and advancement of the banks of the river flow. In the examined section of the Bregalnica River it has been recorded that there is a combination (expansion, extension and rotation) of the migration of the river bed of the Bregalnica River, where on the right bank of the Bregalnica River, sedimentation of the river sediment is more prevalent, while erosion is of lower values. On the left bank, sedimentation and erosion are almost equally prevalent, with variable values during the entire examined period (Figure 10).
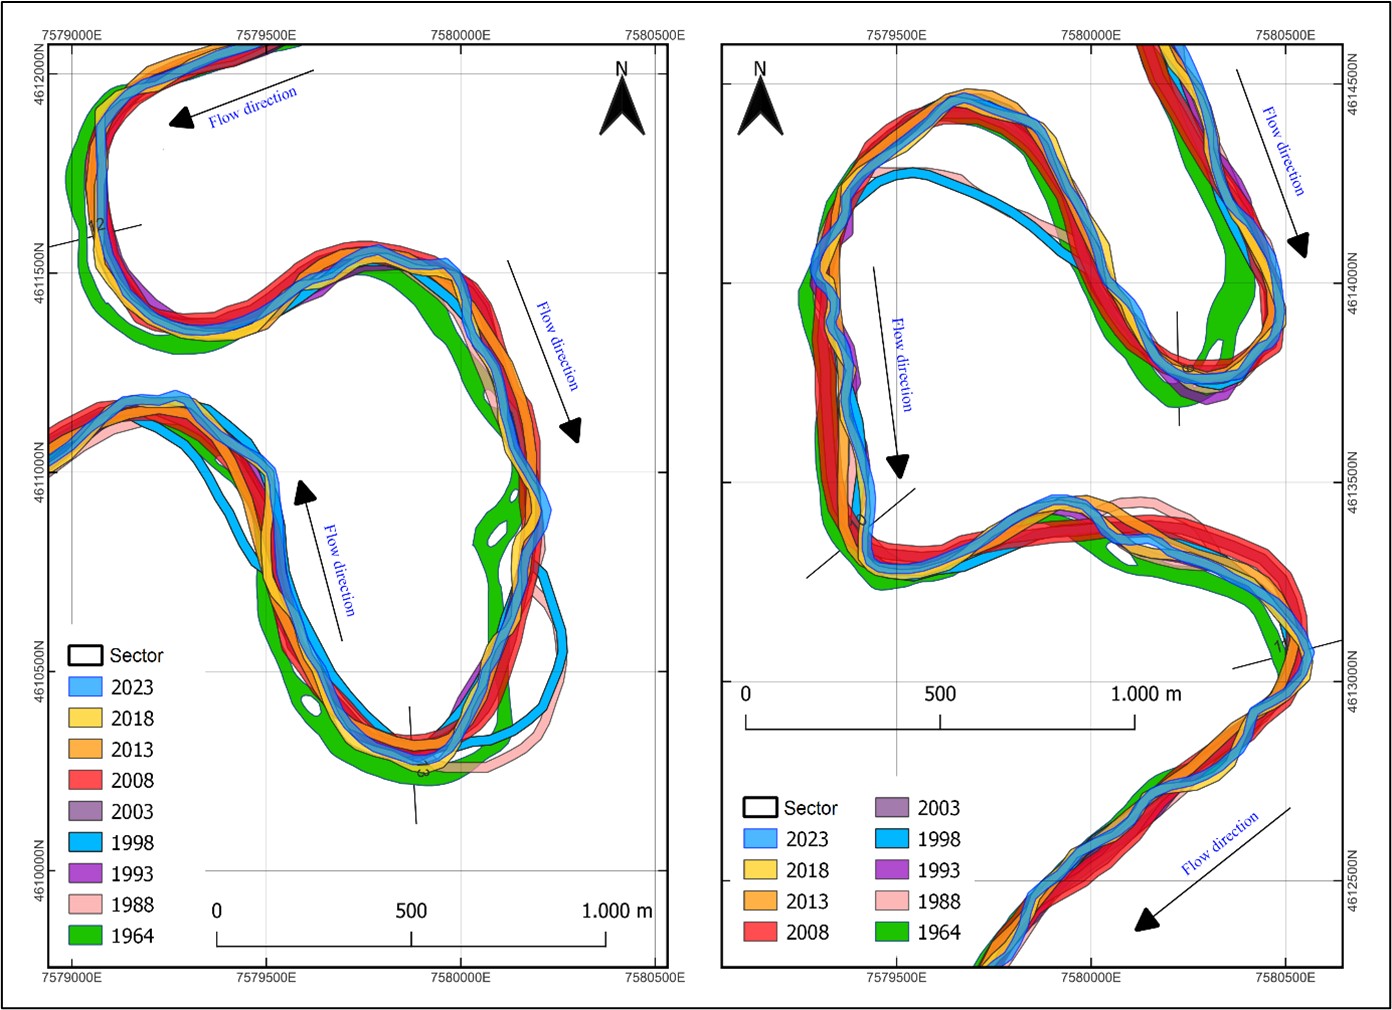
In the studied section of the Vardar River, the right bank has experienced significant sedimentation of river alluvial material throughout the entire studied period of 59 years, while the left bank also experienced the most river bank sedimentation throughout the entire studied period (Figure 11).
4. DISCUSION
In the section of the Bregalnica River, the sinusoidality coefficient is variable, and the smallest sinusoidality value of 2.073 was measured in 1964, while the largest value is 2.168, measured in 2018. On the Bregalnica, the smallest radius of curvature was measured in 2023 (266m), and the largest value was measured in 1988 (517m). The smallest meandering length is in 1964 (149m), while the largest meandering length is in 2013 (2386m). The number of bends changes from 18 in 1964 to 33 bends in 2013 and 2018. There are no significant changes in the meandering amplitude or the maximum amplitude, which ranges from 1853 m in 1964 to 1845 m in 2023. The largest average changes on the right bank for sedimentation are in 1988, 1998, and 2023, while for erosion they are 2003, 2008 and 2013. The largest average changes in sedimentation on the left bank are in 2003 and 2013, while for the erosion process in 1988 and 2008 year.
In the section of the Vardar River, in 1964, the sinusoidality coefficient was 1.128, while the highest value was reached in 2003, when it was 1.237. The number of meandering curves (bends) varies. The largest radius of curvature was measured in 2023 (1269m), while the smallest radius of curvature was measured in 2008 (387m). In terms of meandering lengths, the smallest length was measured in 2013 (427m), while the largest length was measured in 1964 (4294m). The largest measured meandering amplitude was registered in 2008 (1060m), while the smallest amplitude was measured in 1988 (616m). In terms of riverbed migration, sedimentation and erosion act almost equally. The highest sedimentation on the right bank was in 2018, while the highest erosion was in 2008. Sedimentation dominates on the left bank. The highest sedimentation was in 1998, and the highest erosion was in 1998.
From a historical perspective, it can be concluded that the studied sections are characterized by hydromorphological changes over time. In the section of the Bregalnica River, there are no anthropogenic activities such as excavation and separation of river sand, gravel, and stone, or fishponds, to change the riverbed, similar to the section of the Vardar River. As a comparison with well-known rivers in neighboring countries, the meandering of the Sava River on the territory of Slovenia can be recorded, where there is degradation and change of the riverbed in the period from 1989-2006 and after 2009, because part of the water is taken for cooling the nuclear reactor of the Krško Nuclear Power Plant, where there are changes in the river flow about 200 m downstream (Mikoš et al., 2015).
A further comparison can be made with the lateral migration of the river channel of the South Morava River, in the neighboring Republic of Serbia, over 96 years. Three segments with significant meandering were examined in the South Morava. The largest changes were observed in the first meander section, an increase of 32%. The second meander section has an increase of 28%, and the third meander section has an increase of 32% and 37%. These data support the fact of a pronounced process of migration of the lateral channels. That the process is current in the last decade of the observed period is also shown by the second meander section, where in the seven years (2013-2020) an increase of almost 40 m was recorded, i.e., an average of 5.7 m/year, (Langović, 2020).
Another comparison that we can use is the change of the river channel in the central part of the Tisza River in the Republic of Hungary, where various historical cartographic data, hydrological research maps, and satellite images for the period 1869-2014 were used (Nádudvari & Czajka, 2014). Due to the large period, it was decided to investigate a 10-year time series of one of the most prominent meander bends. The bend is divided into 7 sections (4 sections have free development, while 3 sections are stabilized). The first section is stabilized because a settlement was in danger of being affected by lateral erosion, and the fourth and sixth sections are stabilized due to the construction of a highway near the river course. Also, the average width of the Tisza River channel in the analyzed river section has decreased by about 50 m in the period between 1890 and 2005.
The next example for comparison will be the evolution of the Prut River bed in the Republic of Romania. The studied area of the Prut River has a length of 26 km, with a river channel width varying from 41 m to 102 m. Here, the changes that have occurred in the last 125 years are analyzed using the Normalized Difference Water Index (NDWI) (Butnariu et al., 2016). The evolution of river channels is carried out through lateral migration, especially in the case of meandering channels. In the period after the construction of the Stânca-Costeşti Dam (1974-1978), there was a gradual regulation of the evolution of meandering, but a deepening of the river bed occurred, in some cases reaching up to 4 m, which limited the lateral migration of the channel (Radoane et al., 2008). The Prut River channel evolved along a natural meandering path, without anthropogenic influences, but after the construction of the dam, there was a reduction in migration and evolution of the meandering.
The applied GIS based methodology has proven effective for identifying hydromorphological changes in selected meander sections on Vardar and Bregalnica, and it can be used for other river section in Southeast Europe, but each river is different from each other, especially in terms of geographical locations and topographic variability. The methodology demonstrates reliability in alluvial, low-gradient reaches with unconfined floodplains. First, wide floodplain such as lowland meander parts of rivers plays a major role as shaping the river meandering dynamics (Radevski & Gorin, 2017), allowing greater lateral migration, river bank erosion and sedimentation of materials than the rivers who have confined valley or semi-confined areas such as narrow mountain corridor in Southeast Europe. In those areas, the lateral channel mobility is structurally suppressed and morphologically restricted, limiting the changes of planiform metrics, resulting in smaller lateral changes with a stronger vertical activity of the river.
Second, Europe, especially Southeast Europe and Mediterranean is characterized with various hydro-climate regimes with different precipitation patterns (Vicente-Serrano et al., 2025), where they have influence over water level of the river (Radevski et al. 2023), compared with the precipitations pattens in North Macedonia (Radevski et al., 2024). Also, the larger river have greater or extreme flood events, where they can have a substantially different rates in channel changes. Beside that, larger rivers have greater catchment area, which allow them to accumulate larger amount of water from precipitation, and with significant more tributaries, can further affect the amount of water passing through the river bed, and that sometimes can lead to extreme discharge resulting with substantial morphology changes of the river (Leščešen et. al., 2022).
Fundamental constraints in the application of GIS based hydromorphological analysis is the data availability, because they have enormous importance in the analysis, especially spatial data with temporal changes and spatial resolution of the used sources. Historical map, aerial photographs, orthophotos and satellite images and images from remote sensing can differ from each other in positional accuracy, scale, resolution and the acquisition date. All these features can have impact and effect on precision of the mapped rivers channel (Ji et al., 2022). The present study relied on combination of older topographic maps and satellite imagery from Landsat and Sentinel-2 series, which provide adequate resolution for the rivers with size as Vardar. For smaller rivers like Bregalnica tributaries or upland streams, channel boundaries with the spatial resolution of Landsat and Sentinel-2 satellite images become ambiguous, introducing digitization uncertainty, so manual digitization is more preferred (Machala et al., 2015). In addition, longer time intervals between the available satellite dataset (preferably cloud-free of low cloud coverage) may conceal short-term channel movements, while low-resolution satellite images or scanned topographic maps may limit the identification of smaller river bank changes. For this reason, the methodology is most reliable where consistent, high-quality, and multi-temporal datasets and sources are available.
The proposed methodology may be more limited in high-altitude or geomorphologically more dynamic environments than low to medium gradient alluvial plains. In such areas, the river channel is mostly influenced by steeper gradients, debris from the river erosion, torrential processes, which those hydromorphological changes cannot be fully captured by satellite imagery. For such environments, supplementary methodologies including Lidar data and drone photogrammetry are recommended (Backes et. al. 2020). As we can see, this GIS based methodology approach is most suitable for lowland and wide floodplains and moderate dynamic river sections, taking the consideration of the spatial, topographic, hydrological, climatological data, and data-related constraints. This confirms that method is transferable but cannot be universally implemented on every river, but must be adapted to the environmental context of each study area.
5. CONCLUSION
Meandering is a natural fluvial process that develops spatially and significantly influence the surrounding geographical landscape of the river. It represents one of the most significant characteristics of river flowing through lowland areas. Understanding riverbank migration and overall meandering process, is essential for effective river system management and future planning. Although the Vardar River with 388 km length and Bregalnica with 225 km length, only limited sections of their course were selected for analysis, especially in areas with wide floodplains with very little terrain gradient (<4%) and predominantly alluvial soils.
The present study confirms that both selected meanders sections exhibited a measurable long-term change in sinuosity, consisted with progressive channel movement, lateral migration and meander development, especially the Vardar River. This analysis indicates that both sections are morphodynamically active, according to their fluvial and geomorphological local condition of the terrain.
The application of Geographic Information Systems supported by multi-temporal data from remote sensing spanning several decades, and other cartographic data, demonstrates strong capacity for systematic planimetric change detection in alluvial river systems. GIS also enables the creation of a geospatial database that further facilitates the mapping procedure and determination of the planimetric characteristics of the meandering process. This comparative analysis of these two rivers further enhances the transferability of findings other analogue meander systems in the broader regional context, such as Southeastern Europe.
Certain methodological constraints should be acknowledged. The results depend on the availability of and quality of historical topographic maps, orthophotos and satellite imagery, with different spatial resolutions, which may affect the precision of the positional accuracy of the analysis. Also, diverse image resolutions across different time periods may affect the detection of the minor river channel changes, and despite the careful manual digitization process, some positional uncertainty in planimetric measurements remains unavoidable, but less than the automatic digitization process.
Overall, the study demonstrates that GIS based multi-temporal analysis is an effective tool for assessing hydromorphological changes in river meanders. Through systematic quantification of planimetric indicators over several decades with comparative analysis, it provides a valuable framework for long-term river change assessment, and can support future research, river monitoring with sustainable river management in North Macedonia.
REFERENCES
- AKN – Agency for Real Estate Cadastre 2024. National State Coordinate Reference System 7th Zone. https://nipp2.katastar.gov.mk:5003/nipp3/registry/coordinatesystem/EPSG_6316/EPSG_6316.mk.html
- Bag, R., Mondal, I., & Bandyopadhyay, J., 2019. Assessing the oscilation of channel geometry and meander migration cardinality of Bhagirathi River, West Bengal, India. Journal of Geographical Sciences., 29(4), 613-634. http://dx.doi.org/10.1007/s11442-019-1618-z
- Basnayaka, V., Samarasinghe, J.T., Gunathilake, M.B., Muttil, N., Hettiarachchi, D.C., Abeynayaka, A., & Rathnayake, U., 2022. Analysis of Meandering River Morphodynamics Using Satellite Remote Sensing Data - An Application in the Lower Deduru Oya River), Sri Lanka. MDPI Journal Land. https://doi.org/10.3390/land11071091
- Backes, D., Smigaj, M., Schimka, M., Zahs, V., Grznárová, A., & Scaioni, M., 2020. River morphology monitoring of a small-scale alpine riverbed using drone photogrammetry and LiDAR. The International Archives of the Photogrammetry, Remote Sensing and Spatial Information Sciences, 43, 1017-1024.
- Basic Geological Map scale sheet Titov Veles K34-80, Scale 1:100 000, Editorial and Publication of the Federal Geological Survey, Belgrade
- Basic Geological Map, scale sheet Gevgelija K34-106, Scale 1:100 000, Editorial and Publication of the Federal Geological Survey, Belgrade
- Butnariu, D. G., Florian, S., Margarint, M. C., & Mihai, N., 2016. The recent evolution of the Prut River Channel in the territorial administrative unit of Prisacani Commune - IASI County. GEOMAT. 31-40.
https://www.researchgate.net/publication/310426078_THE_RECENT_EVOLUTION_OF_T HE_PRUT_RIVER_CHANNEL_IN_THE_TERRITORIAL_ADMINISTRATIVE_UNIT_OF_PRISACANI_COMMUNE_-IASI_COUNTY - Casado, M. R., Gonzales, R.B., Wright, R., & Bellamy, P., 2016. Quantifying the Effect of Aerial Imagery Resolution in Automated Hydromorpholgical River Characterisation. Remote Sensing, 8(8), 650 http://dx.doi.org/10.3390/rs8080650
- Copernicus 2024, retrieved from Copernicus Open Access Hub:https://scihub.copernicus.eu/
- Crossato, A. 2008, Analysis and modelling of river meandering. Doctoral Thesis, Published at TU Delft Repository. Available at https://resolver.tudelft.nl/uuid:7e6f97a1-89a4-4376-bd1f-9f1ce69278dd
- Fryirs, K.A., & Brierley, G.J., 2013. Geomorphic analysis of river systems: An approach to reading the landscape. Special Issue: Freshwater Geographies, 70(1), 360. https://doi.org/10.1111/nzg.12045
- Gashevski, M., 1979. Basic hydrographic characteristics of the main tributaries of the Vardar in the Republic of Macedonia. Geografski Review, 17, pp. 33-59. Retrieved from https://igeografija.mk/reviews/wp-content/uploads/1979/GR.17.02.pdf
- Gorin, S., 2021. Introduction to Geographic Information Systems. Skopje: Trimaks
- Ivanovski, T., 1970. Interpreter for Basic Geological Map - Sheet Gevgelija, K34-106. Belgrade: Federal Geological Survey, Belgrade
- Ji, Z., Zhu, Y., Pan, Y., Zhu, X., & Zheng, X., 2022. Large-Scale Extraction and Mapping of Small Surface Water Bodies Based on Very High-Spatial-Resolution Satellite Images: A Case Study in Beijing, China. Water, 14(18), 2889. https://doi.org/10.3390/w14182889
- Karajovanović, M., & Hadžimitrova, M., 1982. Interpreter for Basic Geological Map - Sheet Titov Veles K34-80. Belgrade: Federal Geological Survey, Belgrade
- Kummu, M., Lub, X. X., Rasphonec, A., Sarkkulad, J., & Koponen, J., 2008. Riverbank changes along the Mekong River: Remote sensing detection in the Vientiane-Nong Khai area. Quaternary International, 186, 100-112.
http://dx.doi.org/10.1016/j.quaint.2007.10.015 - Langović, M., 2020. Investigation of the lateral channel migration: A case study of the South Morava River (Serbia). Bulletin of the Serbian Geographical Society., 100(1), pp. 1-21.
https://doi.org/10.2298/GSGD2001001L - Legleiter, C.J., 2013. Mapping river depth from publicy available aerial images. River Research and Applications., 29(6). http://dx.doi.org/10.1002/rra.2560
- Leopold, L.B., & Wolman, M., 1957. River Channel Patterns: Braided, Meandering and Straight. Retrieved from: https://www.ansac.az.gov/UserFiles/PDF/04152015/X098_Leopold MeanderingBraidedStraight/RiverChannel Patterns Braided, Meandering, and Straight.pdf
- Leopold, L.B., & Wolman, M.G., 1960. River meanders. 71, 769-779. Retrieved from
https://user.engineering.uiowa.edu/~cee_171/handouts/Leopold_Wolman_1960.pdf - Leščešen, I., Basarin, B., Mudelsee, M. 2022. Extreme discharge analysis of the largest river in South-eastern Europe. 7th Europe Congress of the International Association for Hydro-environment Engineering and Research (IAHR).
https://www.researchgate.net/publication/365450652_Extreme_discharge_analysis_of_the_largest_river_in_South-eastern_Europe - Manevska, M., Dimitrovska, O., Radevski, I., Gorin, S., Kuzmanoski, A., Markoski, B., 2025. Meteorological Parameters versus PM10: Statistical Analysis of the City of Skopje, Republic of North Macedonia Using Multiple Linear Regression. Polish Journal of Environmental Studies. DOI: 10.15244/pjoes/204196.
- Machala, M., Honzova, M., & Klimanek, M., 2015. Generating land-cover maps form remotely sensed data: Manual vectorization versus object-oriented automation. Applied GIS, 11(1), 1-30. doi:http://dx.doi.org/10.4225/03/57D7990BEA4AC
- Mikoš, М., Muck, P., & Savić, V., 2015. The Sava River Channel Changes in Slovenia. Spremembe struge reke Save v Sloveniji. Acta hydrotechnica, 28(49). https://actahydrotechnica.fgg.uni-lj.si/paper/a49mm.pdf
- Mithun, D., Dabojani, D., & Misbah, U., 2012. Evaluation of meandering characteristics using RS & GIS of Manu River. Journal of Water Resource and Protection, 4(3), 163-171. doi: http://dx.doi.org/10.4236/jwarp.2012.43019
- Morais, E.S., Rocha, P.C., & Hooke, J., 2016. Spatiotemporal variations in channel changes caused by cumulative factors in meandering rivers: The Lower Peixe River, Brazil. Geomorphology, 273, 348-360.
https://doi.org/10.1016/j.geomorph.2016.07.026 - Nádudvari, A., & Czajka, A., 2014. Statistical calculations of the tisza river channel changes along vezseny and martfu (Hungary) from 1873-2010. Carpathian Journal of Earth and Environmental Sciences, 9(2), 57-70. Retrieved from https://www.researchgate.net/publication/287562172_Statistical_calculations_of_the_tisza_river_channel_changes_along_vezseny_and_martfu_Hungary_from_1873-2010
- Radevski, I., 2021. Hydrology, Trimaks, Skopje
- Radevski, I., & Gorin, S., 2017. Floodplain analysis for different return periods of river Vardar in Tikvesh valley (Republic of Macedonia). Carpathian Journal of Earth and Environmental Sciences, 12(1), 179-187.https://www.cjees.ro/viewTopic.php?topicId=668
- Radevski, I., Gorin, S., Zlatanoski, V., Petrović, A. M., Kuzmanoski, A., Manevska, E., & Markoski, B. 2023. Determining Streamflow Patterns In North Macedonia Using PCA And AHC Analysis. Mitteilungen der Österreichischen Geographischen Gesellschaft, 165. https://doi.org/10.1553/moegg165-081
- Radevski, I., Hall, J., Gorin, S., Arse Kuzmanoski, A. M. P., Manevska, E., & Ristevski, P., 2024. Characteristics of annual and seasonal precipitation in North Macedonia: change analysis and correlation with the North Atlantic Oscillation (1951–2010). Időjárás = Quarterly Journal of The Hungarian Meteorological Service, 128(1), 75-98. https://doi.org/10.28974/idojaras.2024.1.5
- Raj, R., Sridhar, A., & Chamyal, L.S., 2015. Channel migration and meader cutoff in response to high magnitute flood event: a case study from the Meshwa River, North Gujarat, India. 5 Zeitschrift für Geomorphologie Supplementary Issues, 9(3), 337-353. http://dx.doi.org/10.1127/zfg/2014/0157
- Radoane, M., Radoane, N., Cristea, I., & Gancevici-Oprea, D., 2008. Evaluarea modificărilor contemporane ale albiei râului Prut pe frontiera românească și rolul materialului de albie în evoluția calității resurselor de apă. In Bazinul hidrografic Book, 95-124.
https://www.researchgate.net/publication/284553048_Contemporary_changes_of_the_Prut_River_channel_Romanian_border - Stojmilov, A., 2003. Physical Geography of Republic of Macedonia, Skopje, PMF
- Suyarso, S., Setiawati, M. D., Suprivadi, I., & Prayudha, B., 2023. Climate change indicator, impact, adaptation and innovation at the local level: learn form the people's experience of the coastal plain of Probolinggo, East Java Indonesia. In Climate Change, Community Response and Resilience. (Sixth ed.). Elsevier. http://dx.doi.org/10.1016/B978-0-443-187070.00005-9
- Topographic map, sheet Titov Veles 732_4, scale 1:50000, Editorial and publication of Military Geographical Institute, Belgrade
- Topographic map, sheet Strumica 784_4, scale 1:50000, Edited and published by Military Geographical Institute, Belgrade
- Thomson, J., 1876. On the origin of windings of rivers in alluvial plains with remarks on the flow of water round bends in pipes. 25, pp. 5-8. London: Royal Society of London. Retrieved from https://royalsocietypublishing.org/doi/pdf/10.1098/rspl.1876.0004
- USGS 2024, retrieved from United States Geological Survey:https://earthexplorer.usgs.gov/
- Vasileski, D., 2004. Hydrology, Internal script, Skopje
- Vicente-Serrano, S.M., Tramblay, Y., Reig, F. et al. 2025. High temporal variability not trend dominates Mediterranean precipitation. Nature 639, 658–666. https://doi.org/10.1038/s41586-024-08576-6
- Walther, J.V., 2014. Earth's Natural Resources. Book topics Natural Resource. Publisher Burlington, MA: Jones & Bartlett Learning. Available at: https://archive.org/details/earthsnaturalres0000walt
- Yang, C., Damen, M.J., & Zuidam, R.A., 1999. Satellite remote sensing and GIS for the analysis of channel migration in the active Yellow river delta, China. International Journal of Applied Earth Observation and Geoinformation, 1(2), 146-157.
http://dx.doi.org/10.1109/IGARSS.1996.516948 - Yang, C., Cai, X., Wang, X., Yan, R., Zhang, Q., & Lu, X., 2015. Remotely Sensed Trajectory Analysis of Channel Migration in Lower Jingjiang Reach, during Period of 1983-2013. Remote Sensing, 7(12), 16241-16256. http://dx.doi.org/10.3390/rs71215828