1. INTRODUCTION
Marine ecosystems are dynamic environments where organisms continuously interact with trace metals originating from both natural weathering and human activities. Essential elements such as Cu, Fe, Ni, and Zn are required for normal physiology, yet their elevated presence can signal environmental exposure and, in some contexts, ecological stress (Luoma & Rainbow, 2008; Rainbow, 2002; Zeng et al., 2024). Coastal waters receive metal inputs through river discharge, sediment resuspension, urban runoff, aquaculture and port activities, and broader coastal development, with local vulnerability shaped by geomorphology and shoreline use (Förstner & Wittmann, 1981; Mohd et al., 2021; Zanuri et al., 2020). Because metals can accumulate and move through food webs, monitoring their distribution in marine organisms remains fundamental for linking environmental processes to potential dietary exposure, as shown widely in fish and seafood-based assessments (Burger & Gochfeld, 2005; Shafiuddin Ahmed et al., 2019; Tek & Ng, 2024; Yulyana et al., 2023). This need is reinforced by recent syntheses emphasizing ecosystem-level impacts and variable bioaccumulation responses across aquatic settings (Razali et al., 2024; Zeng et al., 2024).
Jellyfish have increasingly attracted attention as biological indicators of marine environmental conditions, especially in coastal waters undergoing rapid ecological change. Their gelatinous bodies are largely water, but they interact actively with seawater through respiration, feeding, and tissue exchange, allowing them to integrate chemical signals from the water column over short ecological time scales (Templeman & Kingsford, 2012). In addition, the rising frequency and visibility of jellyfish blooms in many regions has been linked with human proliferation and environmental perturbations, suggesting that jellyfish can reflect broader ecosystem shifts alongside chemical exposure dynamics (Purcell, 2012). Importantly, empirical work has demonstrated that trace element burdens can vary by coastal setting, including in areas influenced by mining and other anthropogenic activities, supporting their value for spatial diagnosis (Muñoz-Vera et al., 2016). Recent evaluations have explicitly highlighted the utility of jellyfish as marine biomonitors, while also noting the need for standardized sampling designs and spatial–temporal replication to interpret signals robustly (Templeman et al., 2021). Compared with the long tradition of using fish and benthic invertebrates for biomonitoring (Phillips & Rainbow, 1993; Luoma & Rainbow, 2008), jellyfish remain underutilised, despite their ecological relevance and their increasing role in human consumption in several coastal regions.
Human health risk assessment is therefore an essential component of marine environmental monitoring when seafood or edible marine organisms are consumed. Trace metals in edible tissues can contribute to dietary exposure, and risk interpretation requires quantitative comparison with health-based guidance values and tolerable intake limits set by authoritative bodies. For nickel, risk characterization has been strengthened by major evaluations and updates that inform intake-based assessments and uncertainty considerations (EFSA, 2010, 2020). International guidance on tolerable intake concepts and contaminant evaluations has also been developed through FAO and WHO expert processes, supporting the use of intake metrics in food safety contexts (JECFA, 1982; WHO, 1993). In applied studies, intake-based methods and hazard quotients are commonly used to translate measured concentrations into public health meaning, and recent work across aquatic systems continues to show how risk varies by species, location, and consumer group, including higher sensitivity in children in some settings (Arumugam et al., 2024; Sehrin et al., 2025; Shafiuddin Ahmed et al., 2019). At the same time, ecological risk assessments and source identification approaches remain important for interpreting exposure pathways and identifying controllable contributors in aquatic environments (Talukder et al., 2022; Zhang et al., 2022).
Against this background, the present study investigates Cu, Fe, Ni, and Zn concentrations in multiple jellyfish populations collected from selected coastal locations and evaluates the associated health risks of their consumption. By combining metal measurements with dietary exposure indices, and proportional comparisons with tolerable intake benchmarks, the study links environmental signals to human exposure relevance using methods consistent with contemporary seafood safety research (Tek & Ng, 2024; Sehrin et al., 2025). The work is also positioned within the broader biomonitoring and sustainability agenda, where interpreting trace metals supports coastal ecosystem management, pollution mitigation, and responsible governance (Phillips & Rainbow, 1993; Luoma & Rainbow, 2008; Zanuri et al., 2020). For Malaysia, this perspective aligns with the growing body of regional evidence on metal burdens and health risk implications in seafood and coastal organisms, including Ni, Cu, and Zn assessments and their connection to governance-oriented sustainability thinking (Yap & Al-Mutairi, 2022a, 2022b, 2023; Yap et al., 2024). Overall, by integrating jellyfish biomonitoring with intake-based risk framing and pollution context, the study aims to strengthen understanding of coastal metal dynamics, seafood safety, and the broader sustainability of coastal ecosystems.
2. MATERIALS AND METHODS
2.1. Sampling design and field collection of jellyfish
Field sampling of jellyfish populations was conducted at seven coastal and estuarine locations in Peninsular Malaysia between April and August 2024 (Figure 1; Table 1). The sampling sites comprised Sungai Janggut, Kukup, Kelanang, and four subsites within the Merlimau coastal area (Merlimau-1 to Merlimau-4). These sites were selected to represent different coastal environments along the west coast, including estuarine waters, nearshore marine habitats, and semi-enclosed coastal zones where jellyfish occurrences are commonly reported. Geographic coordinates for each site were recorded using a handheld GPS unit to ensure spatial accuracy and reproducibility of sampling locations.
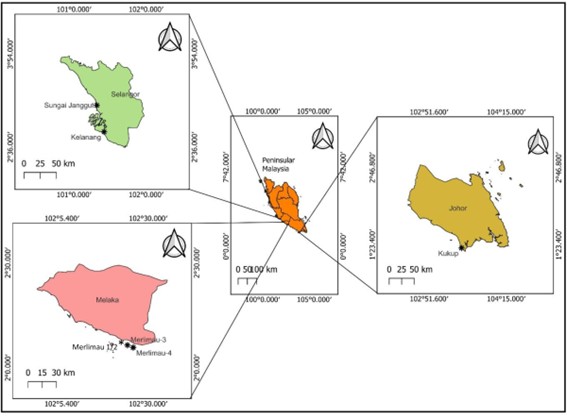
Table 1: The sample details of all populations of jellyfish investigated in the present study.
|
Site |
Location |
Lat |
Long |
Date |
Code |
Species |
|
1 |
Sungai Janggut |
3.180417 |
101.3159 |
7 May 2024 |
J-CC |
Chrysaora chinensis |
|
2 |
Sungai Janggut |
3.180417 |
101.3159 |
5 August 2024 |
J-PP |
Phyllorhiza punctata |
|
|
Sungai Janggut |
3.180417 |
101.3159 |
5 August 2024 |
J-LR |
Lobonemoides robustus |
|
|
Sungai Janggut |
3.180417 |
101.3159 |
5 August 2024 |
J-CY |
Cyanea sp. |
|
2 |
Kukup |
1.325889 |
103.4447 |
12 Aug 2024 |
K-RH |
Rhopilema hispidum |
|
3 |
Kelanang |
2.81199505 |
101.4172 |
18 April 2024 |
K-CY |
Cyanea sp. |
|
4 |
Merlimau-1 |
2.096284 |
102.4292 |
3 August 2024 |
M-LR-1 |
Lobonemoides robustus |
|
|
|
2.096284 |
102.4292 |
12 August 2024 |
M-LR-2 |
Lobonemoides robustus |
|
5 |
Merlimau-2 |
2.096284 |
102.4292 |
3 August 2024 |
M-CY-1 |
Cyanea sp. |
|
|
|
2.096284 |
102.4292 |
12 August 2024 |
M-CY-2 |
Cyanea sp. |
|
6 |
Merlimau-3 |
2.107622 |
102.4017 |
3 August 2024 |
M-PP-1 |
Phyllorhiza punctata |
|
|
|
2.107622 |
102.4017 |
4 August 2024 |
M-PP-2 |
Phyllorhiza punctata |
|
7 |
Merlimau-4 |
2.096075 |
102.4288 |
3 August 2024 |
M-CC-1 |
Chrysaora chinensis |
|
|
|
2.096075 |
102.4288 |
4 August 2024 |
M-CC-2 |
Chrysaora chinensis |
At Sungai Janggut, multiple jellyfish taxa were collected during two sampling events in May and August 2024. This site yielded four taxa: Chrysaora chinensis, Phyllorhiza punctata, Lobonemoides robustus, and Cyanea sp. Sampling at Kukup was conducted in August 2024, where Rhopilema hispidum was collected. At Kelanang, sampling was carried out in April 2024 and yielded Cyanea sp. These locations represent distinct ecological settings with varying hydrodynamic and salinity conditions that may influence species distribution.
The Merlimau coastal zone was divided into four subsites to capture local spatial variation within a relatively confined geographical area. At Merlimau-1, Lobonemoides robustus was collected during two sampling dates in August 2024. Merlimau-2 yielded Cyanea sp. on two separate sampling occasions. At Merlimau-3, two collections of Phyllorhiza punctata were made in early August 2024. Merlimau-4 was sampled on consecutive days, yielding two collections of Chrysaora chinensis. The subdivision of Merlimau into multiple sampling units allowed for replication and assessment of temporal variability over short time intervals.
Jellyfish specimens were collected directly from surface or near-surface waters using manual dip nets or hand collection where feasible, depending on abundance and accessibility at each site. Sampling was conducted during daylight hours under calm to moderate sea conditions to ensure safe handling and minimize specimen damage. Each collected specimen was assigned a unique sample code corresponding to location, species, and sampling sequence. Field notes included date of collection, site name, and coordinates. Species identification was performed based on external morphological characteristics following standard taxonomic references for Indo-Pacific scyphozoans. This sampling framework allowed coverage of multiple habitats and repeated temporal observations at selected sites, providing a representative dataset of jellyfish occurrence across the study region during the 2024 sampling period.
In the laboratory, all jellyfish were individually measured for diameter and total body wet weights. Mean diameters ranged from as small as 9.50 cm in M-CC-2 and 10.0 cm in M-PP-1 to the largest individuals recorded at Merlimau-1 (M-LR-1), with a mean diameter of 53.0 cm, followed by Kukup’s K-RH at 40.1 cm and Merlimau-2’s M-CY-2 at 42.5 cm. Moderate-sized populations included J-PP (26.1 cm), M-CY-1 (26.5 cm), J-CY (24.2 cm), J-LR (22.6 cm), and K-CY (23.9 cm), while smaller individuals were observed at J-CC (12.1 cm) and M-CC-1 (10.2 cm). Diameter variability was generally low at several Merlimau subsites where standard deviations were zero, indicating uniform specimen size, whereas greater variation occurred at K-RH, J-PP, and J-LR. Conversion factor values also differed across populations, with the highest means recorded at M-PP-1 (0.031), M-CC-1 (0.030), and M-CY-1 (0.026), while the lowest values occurred at J-LR (0.001) and K-CY (0.003).
2.2. Sample preparation for metal analysis
In the laboratory, samples were rinsed thoroughly with distilled water to remove adhering sediments and debris. Jellyfish tissues were separated using acid washed stainless steel instruments. Each sample was homogenised using a clean laboratory homogeniser. Homogenised tissues were oven dried at 60 °C to constant weight to remove moisture. The dried samples were then ground into fine powder using a clean mortar and pestle and stored in acid washed polyethylene containers prior to digestion.
Approximately 0.5 g of dried and homogenised tissue was accurately weighed and transferred into digestion vessels. Samples were digested using concentrated nitric acid (HNO₃, analytical grade). The digestion was performed on a hot plate at controlled temperature until complete dissolution of organic matter and a clear solution was obtained. After cooling, digested samples were filtered where necessary and diluted to a known final volume with deionised water. Reagent blanks were prepared using the same digestion procedure without biological material to monitor potential contamination.
Concentrations of Cu, Zn, Ni and Fe were determined using flame atomic absorption spectrophotometry equipped with an air-acetylene flame system. Calibration curves were prepared using certified standard solutions for each element. Instrument calibration was verified periodically using quality control standards to ensure analytical accuracy and stability. Each digested sample solution was aspirated into the air-acetylene flame, and absorbance was measured at element specific wavelengths according to manufacturer recommended operating conditions. Metal concentrations were calculated from the calibration curves and expressed on a dry weight basis.
For quality assurance and quality control, all glassware and equipment were soaked in dilute nitric acid and rinsed thoroughly with deionised water prior to use. Analytical blanks and standard reference solutions were analysed together with samples to ensure method reliability. Replicate analyses were performed to assess analytical precision. Recovery of metals was verified through analysis of certified reference materials or spiked samples where available.
2.3. Data Treatment
Data treatment formed an essential component of the human health risk assessment HHRA framework applied in this study. Laboratory-generated metal concentration data were converted into exposure indicators and compared against established international safety benchmarks. Specifically, the measured concentrations were evaluated using two complementary approaches: estimation of target hazard quotient (THQ), and assessment of estimated weekly intake (EWI) relative to provisional tolerable weekly intake (PTWI). These procedures enabled the interpretation of potential health risks associated with seafood consumption.
a) Estimation of Target Hazard Quotient (THQ)
Before calculating the THQ, calculate the estimated daily intake (EDI). EDI uses human consumption and body weight (BW) to determine metal intake.
Calculated using Equation (1):
EDI was calculated on a wet weight basis using the equation EDI = (Cww × IR)/BW, where Cww is the metal concentration (mg/kg wet weight), IR is the ingestion rate (kg/day), and BW is body weight (kg). Because jellyfish intake and body weight vary across Malaysian subpopulations, EDI values were also evaluated using scenario analysis. A conservative intake of 100 g/day was compared with a higher intake of 168 g/day, consistent with reported adult fish consumption patterns in Peninsular Malaysia (Nurul Izzah et al., 2016).
The selection of a daily intake of 100 g for jellyfish consumption and an adult body weight of 62 kg represents a conservative and standardised exposure assumption for risk assessment purposes. In the absence of nationally representative data on jellyfish consumption in Malaysia, a value of 100 g/day was applied as a precautionary proxy aligned with commonly used seafood ingestion assumptions in dietary exposure assessments, ensuring that potential exposure is not underestimated in the evaluated population. This approach is consistent with established risk assessment practice, where default or conservative ingestion rates are adopted when food specific consumption data are limited or unavailable (WHO, 2008; FAO/WHO, 2011). Similarly, the use of a 62 kg adult body weight is based on anthropometric findings from the Malaysian Adult Nutrition Survey, which reported a national mean adult body weight of approximately 62.65 kg and remains widely used as a reference value in Malaysian dietary and exposure assessments (Azmi et al., 2009; Institute for Public Health, 2014, 2019). Although body weight varies across demographic groups and may have increased in recent years, applying this established national reference value allows comparability with previous Malaysian health risk assessments and provides a standardised baseline for evaluating dietary exposure (Institute for Public Health, 2019, 2023).
Mc = WW metal content in samples (mg/kg) after converting from dry weight (DW) to wet weight (WW) basis using conversion factors as shown in Table 2. Nurul Izzah et al. (2016) estimate that the average Malaysian adult weighs 62 kg, and the high-level consumer rate is double that.
The THQ was later determined using Equation (2):

where, ORD = oral reference dose.
Oral reference dose (ORD) calculates a contaminant's lifetime daily ingestion without health risks (USEPA, 2021). The study employed ORD values (µg/kg/day) from the USEPA's regional screening level, including Cu (40.0), Ni (20.0), Fe (700), and Zn (300) (USEPA, 2021).
b) Comparisons between estimated weekly intake (EWI) and provisional tolerable weekly intake (PTWI).
The Joint FAO/WHO Expert Committee on Food Additives created PTWI (JECFA, 2010). Calculating weekly metal exposures and comparing them to PTWI values assessed food consumption's health risks. The PTWI, defined in mg/kg of BW, is the quantity of a substance considered to be present in food or drinking water that may be ingested without harming health over a lifetime (WHO, 1993). Therefore, the amount of seafood from this research that exceeded PTWI limitations was estimated.
The oral reference dose (ORD, µg/kg BW/day) and PTWI (mg/kg BW/week) values for Cu, Ni, Fe, and Zn in this investigation are briefly explained as follows: PTWI for Cu was computed from PMTDI using JECFA (JECFA, 1982, 2021). EFSA-based TDI was used to compute Ni PTWI (EFSA, 2020). PTWI for Fe was computed using JECFA-based preliminary maximum tolerated daily intake (PMTDI) (JECFA, 1983, 2021). PTWI for Zn was computed using JECFA-based provisional tolerable daily intake (PTDI) (JECFA, 1982, 2021).
In order to maintain an average BW of 62 kg as adults in Malaysia (Nurul Izzah et al., 2016), adults need 217000 µg/week of Cu, 5642 µg/week of Ni, 347200 µg/week of Fe, and 434000 µg/week of Zn. To evaluate exposure risk from consumption, Equation (3) determined the EWI for each metal in the sample:

2.4. Statistical analysis and graphical presentation
Descriptive statistical analysis was performed using KGraph software (Version 5, 1986-2022 by Synergy Software).
3. RESULTS
3.1. Ni
Table 2 presents the Ni concentrations in the investigated jellyfish populations with ranges between minimum and maximum values across sampling sites. On a DW basis, Ni concentrations ranged from 8.35 to 105 mg/kg overall. Overall, the data indicate substantial spatial variation in Ni accumulation among species and locations, with several Merlimau populations showing relatively higher concentrations.
Table 3 shows the EDI of Ni and THQ values with clear ranges across jellyfish populations. EDI values ranged from 0.063 to 0.615 µg/day, with the highest mean intake recorded in M-LR-2 (0.615 µg/day), followed by M-PP-1 (0.525 µg/day), M-LR-1 (0.495 µg/day), and M-CY-1 (0.395 µg/day). Lower intake values were observed in J-LR and J-CY (0.07 µg/day), M-CC-1 (0.075 µg/day), and K-CY (0.063 µg/day). Correspondingly, THQ values ranged from 0.003 to 0.045.
Table 2. Ni concentrations (mg/kg; dry weight (DW); wet weight (WW)) in all populations of jellyfish investigated in the present study.
|
N |
Mean DW |
Min |
Max |
Mean WW |
Min |
Max |
|
|
J-CC |
5 |
17.75 |
9.32 |
29.48 |
0.26 |
0.17 |
0.39 |
|
K-RH |
6 |
43.37 |
12.12 |
105 |
0.07 |
0.01 |
0.16 |
|
J-PP |
3 |
8.35 |
8.35 |
8.35 |
0.11 |
0.11 |
0.11 |
|
J-LR |
2 |
12.19 |
11.56 |
12.1 |
0.02 |
0.01 |
0.02 |
|
J-CY |
3 |
10.60 |
9.20 |
11.7 |
0.04 |
0.02 |
0.05 |
|
M-LR-1 |
2 |
20.57 |
16.56 |
24.6 |
0.31 |
0.25 |
0.37 |
|
M-LR-2 |
2 |
30.32 |
30.03 |
30.6 |
0.38 |
0.38 |
0.38 |
|
M-CY-1 |
2 |
21.09 |
19.21 |
22.9 |
0.56 |
0.51 |
0.60 |
|
M-CY-2 |
2 |
21.34 |
20.01 |
22.7 |
0.21 |
0.20 |
0.22 |
|
M-PP-1 |
2 |
10.37 |
9.67 |
11.1 |
0.32 |
0.30 |
0.34 |
|
M-PP-2 |
4 |
12.90 |
11.54 |
14.5 |
0.26 |
0.17 |
0.35 |
|
M-CC-1 |
4 |
16.50 |
8.82 |
21.1 |
0.50 |
0.28 |
0.62 |
|
M-CC-2 |
4 |
21.47 |
20.48 |
23.3 |
0.79 |
0.75 |
0.82 |
|
K-CY |
3 |
13.41 |
12.07 |
14.8 |
0.04 |
0.04 |
0.04 |
Note: J-CC = Sungai Janggut’s Chrysaora chinensis; J-PP = Sungai Janggut’s Phyllorhiza punctata; J-LR = Sungai Janggut’s Lobonemoides robustus; J-CY = Sungai Janggut’s Cyanea sp.; K-RH = Kukup’s Rhopilema hispidum; K-CY = Kelanang’s Cyanea sp.; M-LR-1 = Merlimau-1’s Lobonemoides robustus; M-LR-2 = Merlimau-2’s Lobonemoides robustus; M-CY-1 = Merlimau-1’s Cyanea sp.; M-CY-2 = Merlimau-2’s Cyanea sp.; M-PP-1 = Merlimau-1’s Phyllorhiza punctata; M-PP-2 = Merlimau-2’s Phyllorhiza punctata; M-CC-1 = Merlimau-1’s Chrysaora chinensis; M-CC-2 = Merlimau-2’s Chrysaora chinensis.
Table 3. Estimated daily intake (mg/day) and target hazard quotients (unitless) of Ni in all populations of jellyfish investigated in the present study.
|
Sites |
N |
EDI Mean |
Min |
Max |
THQ Mean |
Min |
Max |
|
J-CC |
5 |
0.416 |
0.27 |
0.63 |
0.021 |
0.013 |
0.031 |
|
K-RH |
6 |
0.122 |
0.02 |
0.25 |
0.006 |
9.15×10⁻⁴ |
0.013 |
|
J-PP |
3 |
0.18 |
0.16 |
0.2 |
0.009 |
0.008 |
0.01 |
|
J-LR |
2 |
0.025 |
0.02 |
0.03 |
0.001 |
8.44×10⁻⁴ |
0.001 |
|
J-CY |
3 |
0.07 |
0.03 |
0.09 |
0.003 |
0.002 |
0.004 |
|
M-LR-1 |
2 |
0.495 |
0.4 |
0.59 |
0.025 |
0.02 |
0.03 |
|
M-LR-2 |
2 |
0.615 |
0.61 |
0.62 |
0.031 |
0.03 |
0.031 |
|
M-CY-1 |
2 |
0.895 |
0.82 |
0.97 |
0.045 |
0.041 |
0.049 |
|
M-CY-2 |
2 |
0.34 |
0.32 |
0.36 |
0.017 |
0.016 |
0.018 |
|
M-PP-1 |
2 |
0.525 |
0.49 |
0.56 |
0.026 |
0.024 |
0.028 |
|
M-PP-2 |
4 |
0.415 |
0.28 |
0.57 |
0.021 |
0.014 |
0.028 |
|
M-CC-1 |
4 |
0.80 |
0.45 |
0.99 |
0.04 |
0.022 |
0.05 |
|
M-CC-2 |
4 |
1.278 |
1.2 |
1.33 |
0.064 |
0.06 |
0.067 |
|
K-CY |
3 |
0.063 |
0.06 |
0.07 |
0.003 |
0.003 |
0.004 |
Note: J-CC = Sungai Janggut’s Chrysaora chinensis; J-PP = Sungai Janggut’s Phyllorhiza punctata; J-LR = Sungai Janggut’s Lobonemoides robustus; J-CY = Sungai Janggut’s Cyanea sp.; K-RH = Kukup’s Rhopilema hispidum; K-CY = Kelanang’s Cyanea sp.; M-LR-1 = Merlimau-1’s Lobonemoides robustus; M-LR-2 = Merlimau-2’s Lobonemoides robustus; M-CY-1 = Merlimau-1’s Cyanea sp.; M-CY-2 = Merlimau-2’s Cyanea sp.; M-PP-1 = Merlimau-1’s Phyllorhiza punctata; M-PP-2 = Merlimau-2’s Phyllorhiza punctata; M-CC-1 = Merlimau-1’s Chrysaora chinensis; M-CC-2 = Merlimau-2’s Chrysaora chinensis.
Table 4 shows the EWI of Ni and the corresponding percentages of EWI relative to PTWI that showed a clear variation across jellyfish populations. Overall, EWI values ranged from 0.12 to 9.31 µg/week. Correspondingly, %EWI/PTWI values ranged from 0.002% to 0.163%. Overall, despite variation among locations and species, all EWI/PTWI% values remained very low (<0.20%), indicating that weekly Ni intake from jellyfish consumption contributes only a small fraction of the tolerable intake level.
3.2. Fe
Table 5 presents Fe concentrations in the investigated jellyfish populations with a wide variation between minimum and maximum values across sampling sites. On a DW basis, Fe concentrations ranged from 20.8 to 2733 mg/kg overall. On a wet weight (WW) basis, Fe concentrations ranged from 0.02 to 40.72 mg/kg. Overall, substantial spatial variability in Fe accumulation was evident among species and locations, particularly within the Merlimau sampling area.
Table 6 shows that the EDI of Fe and corresponding THQ values also varied across jellyfish populations. Overall, EDI values ranged from 0.001 to 21.7 µg/day. Correspondingly, Fe-THQ values ranged from 6.60×10⁻⁷ to 0.043. Overall, all Fe-THQ values remained far below the safety threshold of 1, indicating negligible non-carcinogenic health risk from Fe exposure through jellyfish consumption under the present study conditions.
Table 4. Estimated weekly (EWI; mg/week) and percentages of EWI to provisional tolerable weekly intake (PTWI) (EWI/PTWI%) of Ni in all populations of jellyfish investigated in the present study.
|
N |
EWI Mean |
Min |
Max |
EWI/ PTWI% Mean |
Min |
Max |
|
|
J-CC |
5 |
2.898 |
1.87 |
4.39 |
0.051 |
0.033 |
0.078 |
|
K-RH |
6 |
0.845 |
0.13 |
1.77 |
0.015 |
0.002 |
0.031 |
|
J-PP |
3 |
1.29 |
1.24 |
1.34 |
0.023 |
0.022 |
0.024 |
|
J-LR |
2 |
0.16 |
0.12 |
0.2 |
0.003 |
0.002 |
0.003 |
|
J-CY |
3 |
0.477 |
0.22 |
0.61 |
0.008 |
0.004 |
0.011 |
|
M-LR-1 |
2 |
3.46 |
2.79 |
4.13 |
0.061 |
0.05 |
0.073 |
|
M-LR-2 |
2 |
4.285 |
4.24 |
4.33 |
0.076 |
0.075 |
0.077 |
|
M-CY-1 |
2 |
6.265 |
5.71 |
6.82 |
0.111 |
0.101 |
0.121 |
|
M-CY-2 |
2 |
2.365 |
2.21 |
2.52 |
0.042 |
0.039 |
0.045 |
|
M-PP-1 |
2 |
3.645 |
3.4 |
3.89 |
0.065 |
0.06 |
0.069 |
|
M-PP-2 |
4 |
2.893 |
1.94 |
3.96 |
0.051 |
0.034 |
0.07 |
|
M-CC-1 |
4 |
5.582 |
3.12 |
6.95 |
0.099 |
0.055 |
0.123 |
|
M-CC-2 |
4 |
8.95 |
8.43 |
9.31 |
0.159 |
0.149 |
0.165 |
|
K-CY |
3 |
0.453 |
0.41 |
0.5 |
0.008 |
0.007 |
0.009 |
Note: J-CC = Sungai Janggut’s Chrysaora chinensis; J-PP = Sungai Janggut’s Phyllorhiza punctata; J-LR = Sungai Janggut’s Lobonemoides robustus; J-CY = Sungai Janggut’s Cyanea sp.; K-RH = Kukup’s Rhopilema hispidum; K-CY = Kelanang’s Cyanea sp.; M-LR-1 = Merlimau-1’s Lobonemoides robustus; M-LR-2 = Merlimau-2’s Lobonemoides robustus; M-CY-1 = Merlimau-1’s Cyanea sp.; M-CY-2 = Merlimau-2’s Cyanea sp.; M-PP-1 = Merlimau-1’s Phyllorhiza punctata; M-PP-2 = Merlimau-2’s Phyllorhiza punctata; M-CC-1 = Merlimau-1’s Chrysaora chinensis; M-CC-2 = Merlimau-2’s Chrysaora chinensis.
Table 5. Fe concentrations (mg/kg; dry weight (DW); wet weight (WW)) in all populations of jellyfish investigated in the present study.
|
N |
Mean DW |
Min |
Max |
Mean WW |
Min |
Max |
|
|
J-CC |
5 |
49.8 |
31.0 |
77.3 |
0.78 |
0.48 |
1.42 |
|
K-RH |
6 |
54.5 |
22.4 |
97.1 |
0.09 |
0.02 |
0.14 |
|
J-PP |
3 |
221 |
222 |
222 |
3.04 |
3.04 |
3.04 |
|
J-LR |
2 |
34.4 |
28.7 |
40.1 |
0.04 |
0.03 |
0.04 |
|
J-CY |
3 |
72.9 |
38.2 |
106 |
0.31 |
0.13 |
0.62 |
|
M-LR-1 |
2 |
46.8 |
25.7 |
67.9 |
0.70 |
0.38 |
1.01 |
|
M-LR-2 |
2 |
23.3 |
20.8 |
25.8 |
0.29 |
0.26 |
0.32 |
|
M-CY-1 |
2 |
124 |
36.4 |
212 |
3.27 |
0.96 |
5.58 |
|
M-CY-2 |
2 |
76.0 |
27.9 |
124 |
0.75 |
0.28 |
1.22 |
|
M-PP-1 |
2 |
172 |
123 |
220 |
5.35 |
3.84 |
6.85 |
|
M-PP-2 |
4 |
885 |
33.1 |
2733 |
13.43 |
0.80 |
40.72 |
|
M-CC-1 |
4 |
74.3 |
29.0 |
162 |
2.27 |
0.85 |
5.07 |
|
M-CC-2 |
4 |
150 |
24.2 |
311 |
5.52 |
0.86 |
11.02 |
|
K-CY |
3 |
25.0 |
22.5 |
27.5 |
0.00 |
0.00 |
0.00 |
Note: J-CC = Sungai Janggut’s Chrysaora chinensis; J-PP = Sungai Janggut’s Phyllorhiza punctata; J-LR = Sungai Janggut’s Lobonemoides robustus; J-CY = Sungai Janggut’s Cyanea sp.; K-RH = Kukup’s Rhopilema hispidum; K-CY = Kelanang’s Cyanea sp.; M-LR-1 = Merlimau-1’s Lobonemoides robustus; M-LR-2 = Merlimau-2’s Lobonemoides robustus; M-CY-1 = Merlimau-1’s Cyanea sp.; M-CY-2 = Merlimau-2’s Cyanea sp.; M-PP-1 = Merlimau-1’s Phyllorhiza punctata; M-PP-2 = Merlimau-2’s Phyllorhiza punctata; M-CC-1 = Merlimau-1’s Chrysaora chinensis; M-CC-2 = Merlimau-2’s Chrysaora chinensis.
Table 7 shows that the EWI of Fe and the corresponding percentage of EWI relative to the PTWI showed substantial variation across jellyfish populations. Overall, EWI values ranged from 0.000 to 460.0 µg/week. Correspondingly, EWI/PTWI% values ranged from 1.04×10⁻⁵% to 0.132%. Overall, despite variation among sampling sites and species, all %EWI/PTWI values remained very low (below 0.20%), indicating that weekly Fe intake from jellyfish consumption contributes only a minimal fraction of the tolerable intake level.
Table 6. Estimated daily intake (mg/day) and target hazard quotients (unitless) of Fe in all populations of jellyfish investigated in the present study.
|
Sites |
N |
EDI Mean |
Min |
Max |
THQ Mean |
Min |
Max |
|
J-CC |
5 |
1.26 |
0.78 |
2.30 |
0.002 |
0.001 |
0.003 |
|
K-RH |
6 |
0.14 |
0.03 |
0.22 |
2.06×10⁻⁴ |
4.82×10⁻⁵ |
3.19×10⁻⁴ |
|
J-PP |
3 |
4.90 |
4.6 |
5.20 |
0.007 |
0.006 |
0.008 |
|
J-LR |
2 |
0.06 |
0.05 |
0.07 |
8.73×10⁻⁵ |
7.54×10⁻⁵ |
9.91×10⁻⁵ |
|
J-CY |
3 |
0.50 |
0.2 |
1.00 |
7.18×10⁻⁴ |
2.91×10⁻⁴ |
0.001 |
|
M-LR-1 |
2 |
1.13 |
0.62 |
1.64 |
0.002 |
8.81×10⁻⁴ |
0.002 |
|
M-LR-2 |
2 |
0.47 |
0.42 |
0.52 |
6.73×10⁻⁴ |
6.03×10⁻⁴ |
7.42×10⁻⁴ |
|
M-CY-1 |
2 |
5.28 |
1.55 |
9.00 |
0.008 |
0.002 |
0.013 |
|
M-CY-2 |
2 |
1.20 |
0.44 |
1.96 |
0.002 |
6.34×10⁻⁴ |
0.003 |
|
M-PP-1 |
2 |
8.62 |
6.19 |
11.0 |
0.012 |
0.009 |
0.016 |
|
M-PP-2 |
4 |
21.7 |
1.29 |
65.7 |
0.031 |
0.002 |
0.094 |
|
M-CC-1 |
4 |
3.66 |
1.36 |
8.18 |
0.005 |
0.002 |
0.012 |
|
M-CC-2 |
4 |
8.91 |
1.39 |
17.8 |
0.013 |
0.002 |
0.025 |
|
K-CY |
3 |
0.001 |
0.00 |
0.001 |
7.34×10⁻⁷ |
6.60×10⁻⁷ |
8.07×10⁻⁷ |
Note: J-CC = Sungai Janggut’s Chrysaora chinensis; J-PP = Sungai Janggut’s Phyllorhiza punctata; J-LR = Sungai Janggut’s Lobonemoides robustus; J-CY = Sungai Janggut’s Cyanea sp.; K-RH = Kukup’s Rhopilema hispidum; K-CY = Kelanang’s Cyanea sp.; M-LR-1 = Merlimau-1’s Lobonemoides robustus; M-LR-2 = Merlimau-2’s Lobonemoides robustus; M-CY-1 = Merlimau-1’s Cyanea sp.; M-CY-2 = Merlimau-2’s Cyanea sp.; M-PP-1 = Merlimau-1’s Phyllorhiza punctata; M-PP-2 = Merlimau-2’s Phyllorhiza punctata; M-CC-1 = Merlimau-1’s Chrysaora chinensis; M-CC-2 = Merlimau-2’s Chrysaora chinensis.
Table 7. Estimated weekly (EWI; mg/week) and percentages of EWI to provisional tolerable weekly intake (PTWI) (EWI/PTWI%) of Fe in all populations of jellyfish investigated in the present study.
|
N |
EWI Mean |
Min |
Max |
EWI/ PTWI% Mean |
Min |
Max |
|
|
J-CC |
5 |
8.81 |
5.46 |
16.1 |
0.003 |
0.002 |
0.005 |
|
K-RH |
6 |
1.01 |
0.24 |
1.57 |
2.90×10⁻⁴ |
6.81×10⁻⁵ |
4.51×10⁻⁴ |
|
J-PP |
3 |
34.3 |
29.0 |
39.0 |
0.010 |
0.00 |
0.01 |
|
J-LR |
2 |
0.43 |
0.37 |
0.49 |
1.23×10⁻⁴ |
1.06×10⁻⁴ |
1.40×10⁻⁴ |
|
J-CY |
3 |
3.52 |
1.43 |
7.02 |
0.001 |
4.11×10⁻⁴ |
0.002 |
|
M-LR-1 |
2 |
7.89 |
4.32 |
11.5 |
0.002 |
0.001 |
0.003 |
|
M-LR-2 |
2 |
3.29 |
2.95 |
3.64 |
9.50×10⁻⁴ |
8.50×10⁻⁴ |
0.001 |
|
M-CY-1 |
2 |
36.9 |
10.8 |
63.0 |
0.011 |
0.003 |
0.018 |
|
M-CY-2 |
2 |
8.43 |
3.11 |
13.7 |
0.002 |
8.95×10⁻⁴ |
0.004 |
|
M-PP-1 |
2 |
60.3 |
43.4 |
77.3 |
0.017 |
0.013 |
0.022 |
|
M-PP-2 |
4 |
152 |
9.03 |
460 |
0.044 |
0.003 |
0.132 |
|
M-CC-1 |
4 |
25.6 |
9.54 |
57.3 |
0.007 |
0.003 |
0.017 |
|
M-CC-2 |
4 |
62.4 |
9.70 |
124 |
0.018 |
0.003 |
0.036 |
|
K-CY |
3 |
0.001 |
0.00 |
0.001 |
1.04×10⁻⁶ |
9.32×10⁻⁷ |
1.14×10⁻⁶ |
Note: J-CC = Sungai Janggut’s Chrysaora chinensis; J-PP = Sungai Janggut’s Phyllorhiza punctata; J-LR = Sungai Janggut’s Lobonemoides robustus; J-CY = Sungai Janggut’s Cyanea sp.; K-RH = Kukup’s Rhopilema hispidum; K-CY = Kelanang’s Cyanea sp.; M-LR-1 = Merlimau-1’s Lobonemoides robustus; M-LR-2 = Merlimau-2’s Lobonemoides robustus; M-CY-1 = Merlimau-1’s Cyanea sp.; M-CY-2 = Merlimau-2’s Cyanea sp.; M-PP-1 = Merlimau-1’s Phyllorhiza punctata; M-PP-2 = Merlimau-2’s Phyllorhiza punctata; M-CC-1 = Merlimau-1’s Chrysaora chinensis; M-CC-2 = Merlimau-2’s Chrysaora chinensis.
3.3. Zn
Table 8 shows the Zn concentrations in the investigated jellyfish populations showed marked variation between minimum and maximum values across sampling sites. On a DW basis, Zn concentrations ranged from 8.95 to 135 mg/kg. Overall, substantial spatial differences in Zn accumulation were evident, particularly among Merlimau populations, with several sites showing comparatively elevated concentrations.
Table 8. Zn concentrations (mg/kg; dry weight (DW); wet weight (WW)) in all populations of jellyfish investigated in the present study.
|
N |
Mean DW |
Min |
Max |
Mean WW |
Min |
Max |
|
|
J-CC |
5 |
29.1 |
14.1 |
35.9 |
0.50 |
0.12 |
0.93 |
|
K-RH |
6 |
17.9 |
8.95 |
28.6 |
0.04 |
0.02 |
0.08 |
|
J-PP |
3 |
64.5 |
64.5 |
64.5 |
0.88 |
0.88 |
0.88 |
|
J-LR |
2 |
25.0 |
18.8 |
31.2 |
0.03 |
0.03 |
0.03 |
|
J-CY |
3 |
38.7 |
15.4 |
76.2 |
0.19 |
0.04 |
0.45 |
|
M-LR-1 |
2 |
53.5 |
25.6 |
81.5 |
0.80 |
0.38 |
1.22 |
|
M-LR-2 |
2 |
22.3 |
13.8 |
30.7 |
0.28 |
0.17 |
0.39 |
|
M-CY-1 |
2 |
85.4 |
46.8 |
124 |
2.25 |
1.23 |
3.26 |
|
M-CY-2 |
2 |
78.5 |
36.3 |
121 |
0.77 |
0.36 |
1.18 |
|
M-PP-1 |
2 |
51.4 |
19.0 |
83.8 |
1.60 |
0.59 |
2.60 |
|
M-PP-2 |
4 |
46.7 |
14.6 |
124 |
0.78 |
0.35 |
1.85 |
|
M-CC-1 |
4 |
71.3 |
34.7 |
127 |
2.17 |
1.01 |
3.98 |
|
M-CC-2 |
4 |
95.0 |
43.3 |
135 |
3.53 |
1.53 |
5.20 |
|
K-CY |
3 |
13.0 |
11.7 |
14.3 |
0.00 |
0.00 |
0.001 |
Note: J-CC = Sungai Janggut’s Chrysaora chinensis; J-PP = Sungai Janggut’s Phyllorhiza punctata; J-LR = Sungai Janggut’s Lobonemoides robustus; J-CY = Sungai Janggut’s Cyanea sp.; K-RH = Kukup’s Rhopilema hispidum; K-CY = Kelanang’s Cyanea sp.; M-LR-1 = Merlimau-1’s Lobonemoides robustus; M-LR-2 = Merlimau-2’s Lobonemoides robustus; M-CY-1 = Merlimau-1’s Cyanea sp.; M-CY-2 = Merlimau-2’s Cyanea sp.; M-PP-1 = Merlimau-1’s Phyllorhiza punctata; M-PP-2 = Merlimau-2’s Phyllorhiza punctata; M-CC-1 = Merlimau-1’s Chrysaora chinensis; M-CC-2 = Merlimau-2’s Chrysaora chinensis.
Table 9 shows EDI of Zn and the corresponding THQ values varied considerably across jellyfish populations. Overall, EDI values ranged from 0.002 to 8.35 µg/day. Correspondingly, Zn-THQ values ranged from 6.36×10⁻⁶ to 0.039. Overall, all Zn-THQ values remained far below the safety threshold of 1, indicating negligible non-carcinogenic health risk from Zn exposure through jellyfish consumption under the present study conditions.
Table 9. Estimated daily intake (mg/day) and target hazard quotients (unitless) of Zn in all populations of jellyfish investigated in the present study.
|
Sites |
N |
EDI Mean |
Min |
Max |
THQ Mean |
Min |
Max |
|
J-CC |
5 |
0.808 |
0.19 |
1.51 |
0.003 |
6.38×10⁻⁴ |
0.005 |
|
K-RH |
6 |
0.055 |
0.02 |
0.14 |
1.81×10⁻⁴ |
8.33×10⁻⁵ |
4.56×10⁻⁴ |
|
J-PP |
3 |
1.42 |
1.4 |
1.44 |
0.005 |
0.004 |
0.006 |
|
J-LR |
2 |
0.045 |
0.04 |
0.05 |
1.44×10⁻⁴ |
1.37×10⁻⁴ |
1.52×10⁻⁴ |
|
J-CY |
3 |
0.303 |
0.07 |
0.72 |
0.001 |
2.21×10⁻⁴ |
0.002 |
|
M-LR-1 |
2 |
1.29 |
0.62 |
1.96 |
0.004 |
0.002 |
0.007 |
|
M-LR-2 |
2 |
0.45 |
0.28 |
0.62 |
0.001 |
9.28×10⁻⁴ |
0.002 |
|
M-CY-1 |
2 |
3.625 |
1.99 |
5.26 |
0.012 |
0.007 |
0.018 |
|
M-CY-2 |
2 |
1.245 |
0.58 |
1.91 |
0.004 |
0.002 |
0.006 |
|
M-PP-1 |
2 |
2.575 |
0.95 |
4.2 |
0.009 |
0.003 |
0.014 |
|
M-PP-2 |
4 |
1.258 |
0.57 |
2.98 |
0.004 |
0.002 |
0.01 |
|
M-CC-1 |
4 |
3.498 |
1.63 |
6.43 |
0.012 |
0.005 |
0.021 |
|
M-CC-2 |
4 |
5.69 |
2.48 |
8.38 |
0.019 |
0.008 |
0.028 |
|
K-CY |
3 |
0.001 |
0.00 |
0.001 |
2.81×10⁻⁶ |
2.53×10⁻⁶ |
3.09×10⁻⁶ |
Note: J-CC = Sungai Janggut’s Chrysaora chinensis; J-PP = Sungai Janggut’s Phyllorhiza punctata; J-LR = Sungai Janggut’s Lobonemoides robustus; J-CY = Sungai Janggut’s Cyanea sp.; K-RH = Kukup’s Rhopilema hispidum; K-CY = Kelanang’s Cyanea sp.; M-LR-1 = Merlimau-1’s Lobonemoides robustus; M-LR-2 = Merlimau-2’s Lobonemoides robustus; M-CY-1 = Merlimau-1’s Cyanea sp.; M-CY-2 = Merlimau-2’s Cyanea sp.; M-PP-1 = Merlimau-1’s Phyllorhiza punctata; M-PP-2 = Merlimau-2’s Phyllorhiza punctata; M-CC-1 = Merlimau-1’s Chrysaora chinensis; M-CC-2 = Merlimau-2’s Chrysaora chinensis.
Table 10 presents EWI of Zn and the corresponding percentage of EWI relative to the PTWI showed notable variation across jellyfish populations. Overall, EWI values ranged from 0.17 to 58.79 µg/week. Correspondingly, EWI/PTWI% values ranged from 4.49×10⁻⁵% to 0.013%. Overall, despite variability among species and sampling sites, all EWI/PTWI% values remained very low (below 0.02%), indicating that weekly Zn intake from jellyfish consumption contributes only a negligible proportion of the tolerable intake level.
Table 10. Estimated weekly (EWI; mg/week) and percentages of EWI to provisional tolerable weekly intake (PTWI) (EWI/PTWI%) of Zn in all populations of jellyfish investigated in the present study.
|
N |
EWI Mean |
Min |
Max |
EWI/ PTWI% Mean |
Min |
Max |
|
|
J-CC |
5 |
5.65 |
1.34 |
10.5 |
0.001 |
3.09×10⁻⁴ |
0.002 |
|
K-RH |
6 |
0.38 |
0.17 |
0.96 |
8.76×10⁻⁵ |
4.03×10⁻⁵ |
2.21×10⁻⁴ |
|
J-PP |
3 |
9.96 |
9.46 |
10.5 |
0.002 |
0.00 |
0.002 |
|
J-LR |
2 |
0.31 |
0.29 |
0.32 |
6.98×10⁻⁵ |
6.62×10⁻⁵ |
7.34×10⁻⁵ |
|
J-CY |
3 |
2.12 |
0.46 |
5.06 |
4.91×10⁻⁴ |
1.07×10⁻⁴ |
0.001 |
|
M-LR-1 |
2 |
9.03 |
4.31 |
13.8 |
0.002 |
9.92×10⁻⁴ |
0.003 |
|
M-LR-2 |
2 |
3.15 |
1.95 |
4.35 |
7.25×10⁻⁴ |
4.49×10⁻⁴ |
0.001 |
|
M-CY-1 |
2 |
25.4 |
13.9 |
36.8 |
0.006 |
0.003 |
0.008 |
|
M-CY-2 |
2 |
8.69 |
4.03 |
13.4 |
0.002 |
9.30×10⁻⁴ |
0.003 |
|
M-PP-1 |
2 |
18.0 |
6.68 |
29.4 |
0.004 |
0.002 |
0.007 |
|
M-PP-2 |
4 |
8.81 |
3.99 |
20.9 |
0.002 |
9.19×10⁻⁴ |
0.005 |
|
M-CC-1 |
4 |
24.5 |
11.4 |
44.9 |
0.006 |
0.003 |
0.01 |
|
M-CC-2 |
4 |
39.8 |
17.3 |
58.7 |
0.009 |
0.004 |
0.013 |
|
K-CY |
3 |
0.01 |
0.01 |
0.01 |
1.36×10⁻⁶ |
1.22×10⁻⁶ |
1.49×10⁻⁶ |
Note: J-CC = Sungai Janggut’s Chrysaora chinensis; J-PP = Sungai Janggut’s Phyllorhiza punctata; J-LR = Sungai Janggut’s Lobonemoides robustus; J-CY = Sungai Janggut’s Cyanea sp.; K-RH = Kukup’s Rhopilema hispidum; K-CY = Kelanang’s Cyanea sp.; M-LR-1 = Merlimau-1’s Lobonemoides robustus; M-LR-2 = Merlimau-2’s Lobonemoides robustus; M-CY-1 = Merlimau-1’s Cyanea sp.; M-CY-2 = Merlimau-2’s Cyanea sp.; M-PP-1 = Merlimau-1’s Phyllorhiza punctata; M-PP-2 = Merlimau-2’s Phyllorhiza punctata; M-CC-1 = Merlimau-1’s Chrysaora chinensis; M-CC-2 = Merlimau-2’s Chrysaora chinensis.
3.4. Cu
Table 11 shows the Cu concentrations in the investigated jellyfish populations showed variation between minimum and maximum values across sampling sites. On a DW basis, Cu concentrations ranged from 1.62 to 11.50 mg/kg. Overall, spatial differences in Cu accumulation were evident among species and locations, with several Merlimau populations showing comparatively higher wet weight concentrations.
Table 11. Cu concentrations (mg/kg; dry weight (DW); wet weight (WW)) in all populations of jellyfish investigated in the present study.
|
N |
Mean DW |
Min |
Max |
Mean WW |
Min |
Max |
|
|
J-CC |
5 |
4.65 |
3.69 |
5.72 |
0.08 |
0.03 |
0.16 |
|
K-RH |
6 |
4.34 |
3.61 |
4.95 |
0.01 |
0.00 |
0.02 |
|
J-PP |
3 |
6.21 |
6.21 |
6.21 |
0.08 |
0.08 |
0.08 |
|
J-LR |
2 |
4.51 |
3.99 |
5.02 |
0.01 |
0.00 |
0.01 |
|
J-CY |
3 |
5.09 |
4.23 |
6.69 |
0.02 |
0.01 |
0.04 |
|
M-LR-1 |
2 |
2.85 |
2.22 |
3.47 |
0.04 |
0.03 |
0.05 |
|
M-LR-2 |
2 |
3.14 |
2.63 |
3.64 |
0.04 |
0.03 |
0.05 |
|
M-CY-1 |
2 |
5.20 |
4.20 |
6.19 |
0.14 |
0.11 |
0.16 |
|
M-CY-2 |
2 |
4.97 |
3.53 |
6.41 |
0.05 |
0.03 |
0.06 |
|
M-PP-1 |
2 |
2.78 |
1.62 |
3.94 |
0.09 |
0.05 |
0.12 |
|
M-PP-2 |
4 |
4.59 |
2.16 |
10.38 |
0.08 |
0.05 |
0.15 |
|
M-CC-1 |
4 |
5.88 |
3.35 |
8.82 |
0.18 |
0.10 |
0.28 |
|
M-CC-2 |
4 |
8.16 |
5.24 |
11.50 |
0.30 |
0.19 |
0.44 |
|
K-CY |
3 |
3.83 |
3.45 |
4.21 |
0.01 |
0.01 |
0.01 |
Note: J-CC = Sungai Janggut’s Chrysaora chinensis; J-PP = Sungai Janggut’s Phyllorhiza punctata; J-LR = Sungai Janggut’s Lobonemoides robustus; J-CY = Sungai Janggut’s Cyanea sp.; K-RH = Kukup’s Rhopilema hispidum; K-CY = Kelanang’s Cyanea sp.; M-LR-1 = Merlimau-1’s Lobonemoides robustus; M-LR-2 = Merlimau-2’s Lobonemoides robustus; M-CY-1 = Merlimau-1’s Cyanea sp.; M-CY-2 = Merlimau-2’s Cyanea sp.; M-PP-1 = Merlimau-1’s Phyllorhiza punctata; M-PP-2 = Merlimau-2’s Phyllorhiza punctata; M-CC-1 = Merlimau-1’s Chrysaora chinensis; M-CC-2 = Merlimau-2’s Chrysaora chinensis.
Table 12 presents the EDI of Cu and the corresponding THQ values also varied across jellyfish populations. Overall, EDI values ranged from 0.002 to 0.71 µg/day. Correspondingly, Cu-THQ values ranged from 4.62×10⁻⁴ to 0.018. Overall, all Cu-THQ values remained far below the safety threshold of 1, indicating negligible non-carcinogenic health risk from Cu exposure through jellyfish consumption under the present study conditions.
Table 12. Estimated daily intake (mg/day) and target hazard quotients (unitless) of Cu in all populations of jellyfish investigated in the present study.
|
Sites |
N |
EDI Mean |
Min |
Max |
THQ Mean |
Min |
Max |
|
J-CC |
5 |
0.128 |
0.05 |
0.26 |
0.003 |
0.001 |
0.007 |
|
K-RH |
6 |
0.013 |
0.00 |
0.03 |
3.55×10⁻⁴ |
1.13×10⁻⁴ |
7.41×10⁻⁴ |
|
J-PP |
3 |
0.14 |
0.13 |
0.15 |
0.003 |
0.002 |
0.004 |
|
J-LR |
2 |
0.01 |
0.01 |
0.01 |
2.18×10⁻⁴ |
1.31×10⁻⁴ |
3.04×10⁻⁴ |
|
J-CY |
3 |
0.033 |
0.01 |
0.06 |
9.06×10⁻⁴ |
2.96×10⁻⁴ |
0.002 |
|
M-LR-1 |
2 |
0.065 |
0.05 |
0.08 |
0.002 |
0.001 |
0.002 |
|
M-LR-2 |
2 |
0.06 |
0.05 |
0.07 |
0.002 |
0.001 |
0.002 |
|
M-CY-1 |
2 |
0.22 |
0.18 |
0.26 |
0.006 |
0.004 |
0.007 |
|
M-CY-2 |
2 |
0.08 |
0.06 |
0.1 |
0.002 |
0.001 |
0.003 |
|
M-PP-1 |
2 |
0.14 |
0.08 |
0.2 |
0.003 |
0.002 |
0.005 |
|
M-PP-2 |
4 |
0.128 |
0.08 |
0.25 |
0.003 |
0.002 |
0.006 |
|
M-CC-1 |
4 |
0.288 |
0.17 |
0.45 |
0.007 |
0.004 |
0.011 |
|
M-CC-2 |
4 |
0.49 |
0.3 |
0.71 |
0.012 |
0.007 |
0.018 |
|
K-CY |
3 |
0.02 |
0.02 |
0.02 |
4.62×10⁻⁴ |
4.16×10⁻⁴ |
5.09×10⁻⁴ |
Note: J-CC = Sungai Janggut’s Chrysaora chinensis; J-PP = Sungai Janggut’s Phyllorhiza punctata; J-LR = Sungai Janggut’s Lobonemoides robustus; J-CY = Sungai Janggut’s Cyanea sp.; K-RH = Kukup’s Rhopilema hispidum; K-CY = Kelanang’s Cyanea sp.; M-LR-1 = Merlimau-1’s Lobonemoides robustus; M-LR-2 = Merlimau-2’s Lobonemoides robustus; M-CY-1 = Merlimau-1’s Cyanea sp.; M-CY-2 = Merlimau-2’s Cyanea sp.; M-PP-1 = Merlimau-1’s Phyllorhiza punctata; M-PP-2 = Merlimau-2’s Phyllorhiza punctata; M-CC-1 = Merlimau-1’s Chrysaora chinensis; M-CC-2 = Merlimau-2’s Chrysaora chinensis.
Table 13 shows the EWI of Cu and the corresponding percentages of EWI relative to the PTWI that showed variation across jellyfish populations. Overall, EWI values ranged from 0.03 to 3.12 µg/week. Correspondingly, EWI/PTWI% values ranged from 1.46×10⁻⁴% to 9.26×10⁻⁴%. Overall, despite variability among sites and species, all %EWI/PTWI values remained extremely low (below 0.001%), indicating that weekly Cu intake from jellyfish consumption represents only a negligible proportion of the tolerable intake level.
Table 13. Estimated weekly (EWI; mg/week) and percentages of EWI to provisional tolerable weekly intake (PTWI) (EWI/PTWI%) of Cu in all populations of jellyfish investigated in the present study.
|
N |
EWI Mean |
Min |
Max |
EWI/ PTWI% Mean |
Min |
Max |
|
|
J-CC |
5 |
0.90 |
0.35 |
1.84 |
4.16×10⁻⁴ |
1.62×10⁻⁴ |
8.47×10⁻⁴ |
|
K-RH |
6 |
0.098 |
0.03 |
0.21 |
4.59×10⁻⁵ |
1.46×10⁻⁵ |
9.56×10⁻⁵ |
|
J-PP |
3 |
0.96 |
0.94 |
0.98 |
0.0004 |
0.0001 |
4.42×10⁻⁴ |
|
J-LR |
2 |
0.07 |
0.04 |
0.09 |
2.81×10⁻⁵ |
1.69×10⁻⁵ |
3.92×10⁻⁵ |
|
J-CY |
3 |
0.25 |
0.08 |
0.44 |
1.17×10⁻⁴ |
3.82×10⁻⁵ |
2.05×10⁻⁴ |
|
M-LR-1 |
2 |
0.48 |
0.37 |
0.59 |
2.21×10⁻⁴ |
1.72×10⁻⁴ |
2.70×10⁻⁴ |
|
M-LR-2 |
2 |
0.45 |
0.37 |
0.52 |
2.04×10⁻⁴ |
1.71×10⁻⁴ |
2.37×10⁻⁴ |
|
M-CY-1 |
2 |
1.55 |
1.25 |
1.84 |
7.12×10⁻⁴ |
5.75×10⁻⁴ |
8.48×10⁻⁴ |
|
M-CY-2 |
2 |
0.55 |
0.39 |
0.71 |
2.54×10⁻⁴ |
1.81×10⁻⁴ |
3.27×10⁻⁴ |
|
M-PP-1 |
2 |
0.98 |
0.57 |
1.38 |
4.50×10⁻⁴ |
2.63×10⁻⁴ |
6.37×10⁻⁴ |
|
M-PP-2 |
4 |
0.89 |
0.55 |
1.75 |
4.12×10⁻⁴ |
2.52×10⁻⁴ |
8.04×10⁻⁴ |
|
M-CC-1 |
4 |
2.01 |
1.18 |
3.12 |
9.26×10⁻⁴ |
5.45×10⁻⁴ |
0.001 |
|
M-CC-2 |
4 |
3.43 |
2.10 |
5.00 |
0.002 |
9.67×10⁻⁴ |
0.002 |
|
K-CY |
3 |
0.13 |
0.12 |
0.14 |
5.97×10⁻⁵ |
5.37×10⁻⁵ |
6.56×10⁻⁵ |
Note: J-CC = Sungai Janggut’s Chrysaora chinensis; J-PP = Sungai Janggut’s Phyllorhiza punctata; J-LR = Sungai Janggut’s Lobonemoides robustus; J-CY = Sungai Janggut’s Cyanea sp.; K-RH = Kukup’s Rhopilema hispidum; K-CY = Kelanang’s Cyanea sp.; M-LR-1 = Merlimau-1’s Lobonemoides robustus; M-LR-2 = Merlimau-2’s Lobonemoides robustus; M-CY-1 = Merlimau-1’s Cyanea sp.; M-CY-2 = Merlimau-2’s Cyanea sp.; M-PP-1 = Merlimau-1’s Phyllorhiza punctata; M-PP-2 = Merlimau-2’s Phyllorhiza punctata; M-CC-1 = Merlimau-1’s Chrysaora chinensis; M-CC-2 = Merlimau-2’s Chrysaora chinensis.
4. DISCUSSION
4.1. The overall low health risks of Cu, Fe, Ni and Zn from jellyfish consumption
The integrated results from Tables 2 to 13 consistently demonstrate that the health risks associated with the consumption of jellyfish contaminated with Cu, Fe, Ni, and Zn are low across all sampling sites. Although measurable concentrations of these metals were detected in both DW and WW tissues, the calculated exposure indicators remain well within safe limits. EDI and EWI values for all four metals were relatively small across populations, reflecting limited transfer of metal burdens to consumers under the assumed intake scenario. More importantly, all THQ values for Cu, Fe, Ni, and Zn were substantially below the threshold value of 1, indicating no significant non-carcinogenic health risk. These findings are consistent with previous studies on edible jellyfish, which also reported relatively low dietary risks despite detectable metal concentrations in tissues (Bhuyan et al., 2024; Bhuyan et al., 2026; Cammilleri et al., 2025). Similarly, investigations of edible Mediterranean jellyfish have shown that trace metals do not necessarily accumulate to levels of concern over time, reinforcing the generally low risk profile associated with jellyfish consumption (Basso et al., 2021).
The EWI/PTWI% values were extremely low for all metals and all sampling populations, often contributing only minute fractions of tolerable intake levels. Even where relatively higher metal concentrations were recorded in certain Merlimau populations, these elevations did not translate into meaningful health risks because exposure levels remained proportionally low. Comparable findings have been reported from other coastal environments, where measured tissue concentrations may appear variable yet still result in negligible health risk when intake calculations are performed (Duysak et al., 2013; Fukushi et al., 2006). Experimental studies further indicate that although jellyfish can be exposed to metals in their environment, their biological characteristics often limit long-term retention in edible tissues (Lucas & Horton, 2014). Overall, the combined evidence confirms that consumption of the investigated jellyfish populations does not pose immediate public health concern under the exposure assumptions applied in this study.
4.2. Biological insights of the low risks of heavy metals that are not to be taken lightly
Despite the reassuringly low risk indices, the biological significance of metal accumulation in jellyfish should not be underestimated. Jellyfish possess high water content, rapid tissue turnover, and relatively simple body organization, all of which influence metal uptake, storage, and dilution dynamics. These biological characteristics often reduce apparent metal concentrations on a wet weight basis, thereby lowering estimated exposure risks to consumers. However, such dilution does not necessarily indicate absence of environmental contamination. Physiological studies demonstrate that metals can influence key cellular and biochemical functions in jellyfish, including nematocyst discharge and venom activity, even at relatively low exposure levels (Morabito et al., 2014). Similarly, metal exposure has been shown to affect osmotic regulation and cellular volume control in jellyfish tissues, highlighting the sensitivity of physiological processes to environmental contaminants (Morabito et al., 2013).
Furthermore, jellyfish function as integrators of surrounding water chemistry and trophic interactions. Their metal burdens reflect ambient environmental exposure, planktonic food sources, and local geochemical conditions. Experimental ecotoxicological studies have demonstrated that metals can affect not only jellyfish but also associated trophic components such as microalgae and zooplankton, indicating broader ecosystem-level implications of metal presence (Mercado et al., 2023). Even when human health risks are minimal, the presence of measurable metal levels reveals ongoing metal circulation within coastal ecosystems. Chronic low-level exposure may still influence physiological processes such as metabolism, oxidative stress responses, and reproductive performance. Therefore, low risk to humans does not equate to ecological insignificance. The metal signatures recorded in jellyfish represent meaningful environmental signals that must be interpreted within broader ecological and biogeochemical contexts (Dierssen et al., 2001).
4.3. The need for compulsory biomonitoring of heavy metals in jellyfish on a regular spatial–temporal basis
The spatial variability observed among sampling locations, particularly within the Merlimau subsites, clearly demonstrates that metal accumulation is not uniform across coastal environments. Differences in hydrodynamics, sediment interactions, anthropogenic inputs, and seasonal conditions can produce localized metal enrichment. Temporal variation is also evident from repeated sampling at the same sites, confirming that metal concentrations can fluctuate over relatively short time scales. Similar spatial heterogeneity in jellyfish metal burdens has been reported in different marine regions, reinforcing the importance of repeated and site-specific monitoring (Duysak et al., 2013; Bhuyan et al., 2024).
These findings support the need for systematic and continuous biomonitoring of heavy metals using jellyfish populations. Regular monitoring across multiple locations and time periods would enable early detection of environmental changes, emerging contamination sources, and shifting ecological baselines. Jellyfish are especially suitable biomonitors because they are widely distributed, seasonally abundant, and directly linked to pelagic food webs. Their ability to reflect surrounding chemical conditions has long been recognised in marine trace metal studies (Dierssen et al., 2001). Establishing routine spatial–temporal monitoring programmes would strengthen environmental surveillance, support seafood safety assessments, and provide long-term datasets necessary for detecting trends associated with coastal development and climate variability. The growing interdisciplinary interest in jellyfish biology, ranging from ecological studies to biomimetic engineering research, further highlights their importance as model organisms that respond sensitively to environmental conditions (Ye et al., 2022; Najem et al., 2012; Velayutham et al., 2025).
4.4. The connection to sustainability of coastal areas using metal levels in jellyfish
Metal concentrations in jellyfish provide valuable insight into the ecological condition and sustainability of coastal systems. Coastal sustainability depends on maintaining balanced biogeochemical cycles, preserving water quality, and preventing excessive accumulation of contaminants in food webs. The generally low but detectable levels of Cu, Fe, Ni, and Zn observed in this study suggest that the investigated coastal environments are not heavily polluted, yet they remain subject to ongoing metal inputs. Similar observations have been made in urban coastal waters where jellyfish metal levels reflect background environmental exposure rather than severe contamination (Basso et al., 2021).
Because jellyfish respond rapidly to environmental changes, their metal burdens can serve as indicators of ecosystem health and resilience. Experimental research demonstrates that metals influence biological responses across multiple trophic levels, from primary producers to higher consumers, reinforcing their value as integrative ecological indicators (Mercado et al., 2023). Stable and low metal levels may reflect effective dilution, circulation, and self-regulating ecological processes, whereas increasing trends could signal deteriorating environmental quality. Monitoring metal accumulation in jellyfish therefore contributes to evaluating ecosystem sustainability, supporting fisheries management, and maintaining safe seafood resources. In this way, jellyfish act not only as biological organisms but also as environmental sentinels that reflect the balance between anthropogenic pressures and natural coastal functioning (Lucas & Horton, 2014).
4.5. Future recommendations from the present study for governance
The present findings offer several important directions for environmental governance. First, although current health risks are low, precautionary management is essential to prevent future escalation of contamination. Regulatory frameworks should incorporate routine biomonitoring of marine organisms, including jellyfish, as part of coastal environmental assessment programmes. Previous risk assessment studies on edible jellyfish and jellyfish-derived products emphasise the importance of continuous monitoring to safeguard food safety and public health (Cammilleri et al., 2025; Bhuyan et al., 2026).
Second, spatially resolved monitoring should be integrated with coastal planning and pollution control strategies. Identifying localized hotspots and temporal fluctuations will enable targeted intervention and more efficient allocation of management resources. Third, public health monitoring and seafood safety regulations should incorporate emerging biological indicators alongside traditional water and sediment analyses.
Finally, long-term environmental governance should emphasize preventive rather than reactive management. Establishing standardized monitoring protocols, maintaining centralized data repositories, and linking ecological indicators to policy decision-making will strengthen adaptive coastal management. Interdisciplinary developments in jellyfish research, including biomimetic and material science applications, demonstrate the growing recognition of jellyfish as important environmental models that reflect complex system responses (Najem et al., 2011; Yeom & Oh, 2009; Xu et al., 2011). By embedding biomonitoring results into governance systems, the sustainability of coastal ecosystems and the safety of marine food resources can be safeguarded for future generations.
The present study demonstrates clear spatial variability in the accumulation of Cu, Fe, Ni, and Zn among jellyfish populations along the west coast of Peninsular Malaysia. This variability reflects the influence of localized environmental conditions, including estuarine inputs, coastal hydrodynamics, and anthropogenic activities such as urban runoff and aquaculture. The relatively elevated concentrations observed in selected Merlimau sites suggest localized enrichment processes, which may be linked to semi-enclosed coastal morphology and reduced water exchange.
Despite these variations in metal concentrations, the human health risk assessment consistently indicated negligible risk. All calculated THQ values were well below the safety threshold of 1, and the contributions of EWI relative to PTWI remained extremely low across all metals. This finding suggests that jellyfish consumption, under the current assumptions, does not pose a significant non-carcinogenic health risk. Similar observations have been report other seafood-based exposure assessments, where low consumption rates and dilution effects reduce overall risk.
From an ecological perspective, the findings reinforce the role of jellyfish as effective short-term biomonitors of coastal metal dynamics. Unlike benthic organisms, jellyfish integrate signals from the water column over relatively short temporal scales, providing a dynamic reflection of environmental conditions. Their increasing abundance in many coastal ecosystems further enhances their relevance as sentinel organisms.
Overall, this study contributes to the growing body of evidence supporting the integration of biomonitoring and human health risk assessment within coastal sustainability frameworks. By linking environmental exposure to dietary intake, the study provides a holistic understanding of marine ecosystem health and its implications for food safety and environmental governance.
5. CONCLUSIONS
The present study provides a comprehensive assessment of Cu, Fe, Ni, and Zn concentrations in multiple jellyfish populations across selected coastal locations and evaluates the associated human health risks through dietary exposure indices. Although measurable levels of all four metals were detected in both dry and wet tissues, the calculated exposure metrics consistently indicated minimal health concern. Estimated daily and weekly intakes remained low across all sampling populations, and all target hazard quotient values were far below the critical threshold of 1. Similarly, the percentage contributions to provisional tolerable weekly intake were negligible. These findings collectively demonstrate that consumption of the investigated jellyfish populations does not pose significant non-carcinogenic health risks under the assumed intake conditions. Nevertheless, the observed spatial variability in metal concentrations highlights the importance of continued environmental vigilance, as localised differences in accumulation reflect underlying environmental processes and anthropogenic influences.
Beyond the human health perspective, the study underscores the ecological value of jellyfish as sensitive biological indicators of coastal metal dynamics. Even low metal concentrations provide meaningful information about environmental exposure pathways, ecosystem functioning, and the condition of coastal habitats. The results therefore support the integration of jellyfish-based biomonitoring into regular spatial and temporal surveillance programmes as part of sustainable coastal management. Strengthening monitoring frameworks, improving data continuity, and linking biomonitoring outcomes with environmental governance will enhance the capacity to detect early environmental change and guide precautionary decision-making. In this context, the present study contributes both baseline data and a practical framework for advancing marine environmental protection, seafood safety assurance, and long-term coastal sustainability.
Acknowledgements
The authors gratefully acknowledge the undergraduate students for kindly providing the data used in the present study. Their contribution and support in sharing the dataset were essential to the completion of this research and are sincerely appreciated.
REFERENCES
- Arumugam, S. et al., 2024. Evaluation of toxic metals, proximate composition, and length–weight relationships of selected fish species from the Gadananathi River, Southern Tamil Nadu. Environmental Monitoring and Assessment, 196(5), 446. https://doi.org/10.1007/s10661-024-12600-7
- Azmi, M.Y., Junidah, R., Siti Mariam, A., Safiah, M.Y., Fatimah, S., Norimah, A.K., Poh, B.K., Kandiah, M. & Zalilah, M.S., 2009. Body mass index (BMI) of adults: Findings of the Malaysian Adult Nutrition Survey (MANS). Malaysian Journal of Nutrition, 15(2), 97–119.
- Basso, L., Papadia, P., Rizzo, L., Migoni, D., Fanizzi, F.P. & Piraino, S., 2021. Trace metals do not accumulate over time in the edible Mediterranean jellyfish Rhizostoma pulmo (Cnidaria, Scyphozoa) from urban coastal waters. Water, 13(10), 1410. https://doi.org/10.3390/w13101410
- Bhuyan, M.S., Islam, M.T., Haider, S.M.B., Yacoubi, L., Khan, M., Ali, M.M., Pandit, D., Huda, M.M., Akter, S., Rabbi, M.R.I., Kundu, N.K., Hasan, M.M., Mojumder, I.A., Mansour, L.A. & Rabaoui, L.J., 2024. Assessment of heavy metals and proximate composition in jellyfish (Lobonemoides robustus Stiasny, 1920) collected from Cox’s Bazar coast: Human health risk assessment. Marine Pollution Bulletin. https://doi.org/10.1016/j.marpolbul.2024.116899
- Bhuyan, M.S., Pandit, D., Ismail, M., Ali, M.M., Saifullah, M.K., Islam, M.T., Harun-Al-Rashid, A., Bithi, U.H., Kunda, M. & Siddique, M.A.B., 2026. Assessment of heavy metals and proximate composition of a jellyfish (Rhizostoma octopus Gmelin, 1791) from Cox’s Bazar coast, Bay of Bengal, Bangladesh: Tracing contamination sources and human health risks. Marine Pollution Bulletin. https://doi.org/10.1016/j.marpolbul.2026.119363
- Burger, J. & Gochfeld, M., 2005. Heavy metals in commercial fish in New Jersey. Environmental Research, 99(3), 403–412. https://doi.org/10.1016/j.envres.2005.02.001
- Cammilleri, G., Tortorici, M., Pantano, L., Galluzzo, F.G., Pulvirenti, A.M., Buscemi, M.D., Lo Dico, G.M., Macaluso, A., Calabrese, V., Jacob, U.M. & Ferrantelli, V., 2025. Toxic metals and metalloids in collagen supplements of fish and jellyfish origin: Risk assessment for daily intake. Open Medicine, 20. https://doi.org/10.1515/med-2025-1141
- Dierssen, H., Balzer, W. & Landing, W.M., 2001. Simplified synthesis of an 8-hydroxyquinoline chelating resin and a study of trace metal profiles from Jellyfish Lake, Palau. Marine Chemistry, 73, 169–182. https://doi.org/10.1016/S0304-4203(00)00107-9
- Duysak, Ö., Yılmaz, A.B. & Mazlum, Y., 2013. Metal concentrations in different tissues of jellyfish (Rhopilema nomadica Galil, 1990) in Iskenderun Bay, Northeastern Mediterranean. Journal of Animal and Veterinary Advances, 12, 1109–1113. https://doi.org/10.3923/javaa.2013.1109.1113
- EFSA (European Food Safety Authority), 2010. Scientific opinion on the risks to public health related to the presence of nickel in food and drinking water. EFSA Journal, 8(4), 1462. https://doi.org/10.2903/j.efsa.2010.1462
- EFSA (European Food Safety Authority); Schrenk, D.; Bignami, M.; Bodin, L.; Chipman, J.K.; del Mazo, J.; Grasl‐Kraupp, B.; Hogstrand, C.; Hoogenboom, L. (Ron); Leblanc, J.; et al., 2020. Update of the risk assessment of nickel in food and drinking water. EFSA Journal, 18. https://doi.org/10.2903/j.efsa.2020.6268
- FAO/WHO, 2011. Principles and methods for the risk assessment of chemicals in food. Environmental Health Criteria 240. World Health Organization, Geneva.
- Förstner, U. & Wittmann, G.T.W., 1981. Metal pollution in the aquatic environment. Springer.
- Fukushi, K., Minami, S., Kitakata, M., Nishijima, M., Yokota, K., Takeda, S. & Wakida, S.I., 2006. Determination of ammonium cations and alkali and alkaline earth metal cations in jellyfish by capillary zone electrophoresis. Analytical Sciences, 22, 1129–1133. https://doi.org/10.2116/analsci.22.1129
- Institute for Public Health, 2014. Malaysian Adult Nutrition Survey (MANS) 2014: Volume III Food Consumption Statistics of Malaysia. Ministry of Health Malaysia, Kuala Lumpur.
- Institute for Public Health, 2019. National Health and Morbidity Survey (NHMS) 2019: Non-Communicable Diseases, Healthcare Demand and Health Literacy. Ministry of Health Malaysia, Kuala Lumpur.
- Institute for Public Health, 2023. National Health and Morbidity Survey (NHMS) 2023: Key Findings. Ministry of Health Malaysia, Kuala Lumpur.
- JECFA (Joint FAO/WHO Expert Committee on Food Additives), 1982. Evaluation of certain food additives and contaminants (Twenty-sixth report of the Joint FAO/WHO Expert Committee on Food Additives). WHO Technical Report Series, No. 683.
- JECFA (Joint FAO/WHO Expert Committee on Food Additives), 1983. Evaluation of certain food additives and contaminants (Twenty-seventh report of the Joint FAO/WHO Expert Committee on Food Additives). WHO Technical Report Series, No. 696.
- JECFA (Joint FAO/WHO Expert Committee on Food Additives), 2010. Summary and conclusions of the seventy-third meeting of the Joint FAO/WHO Expert Committee on Food Additives. FAO/WHO, Geneva.
- JECFA (Joint FAO/WHO Expert Committee on Food Additives), 2021. Evaluations of the Joint FAO/WHO Expert Committee on Food Additives (up to the 89th JECFA, June 2020). https://apps.who.int/food-additives-contaminants-jecfa-database/search.aspx?fcc=2
- Lucas, C.H. & Horton, A.A., 2014. Short-term effects of the heavy metals aluminium and copper on polyps of the common jellyfish Aurelia aurita. Journal of Experimental Marine Biology and Ecology, 459, 154–161. https://doi.org/10.1016/j.jembe.2014.08.003
- Luoma, S.N. & Rainbow, P.S., 2008. Metal contamination in aquatic environments: Science and lateral management. Cambridge University Press.
- Mercado, B., Valero, N., Roca-Perez, L., Bernabeu-Berni, E. & Andreu-Sánchez, O., 2023. Investigation of metal toxicity on microalgae Phaeodactylum tricornutum, hypersaline zooplankter Artemia salina, and jellyfish Aurelia aurita. Toxics, 11(8), 716. https://doi.org/10.3390/toxics11080716
- Mohd, F.A., Rahman, A.A.A., Maulud, K.N.A., Kamarudin, M.K., Majid, N.A. & Rosli, A., 2021. Geospatial approach for coastal vulnerability assessment of Selangor coast, Malaysia. IOP Conference Series: Earth and Environmental Science, 767(1), 012025. https://doi.org/10.1088/1755-1315/767/1/012025
- Morabito, R., Dossena, S., La Spada, G. & Marino, A., 2014. Heavy metals affect nematocysts discharge response and biological activity of crude venom in the jellyfish Pelagia noctiluca. Cellular Physiology and Biochemistry, 34, 1235–1248. https://doi.org/10.1159/000362979
- Morabito, R., Marino, A. & La Spada, G., 2013. Heavy metals affect regulatory volume decrease (RVD) in nematocytes isolated from the jellyfish Pelagia noctiluca. Comparative Biochemistry and Physiology Part A, 165, 199–206. https://doi.org/10.1016/j.cbpa.2013.03.004
- Muñoz-Vera, A., Peñas Castejón, J.M. & García, G., 2016. Patterns of trace element bioaccumulation in jellyfish from coastal mining areas. Marine Pollution Bulletin, 110(1), 143–150. https://doi.org/10.1016/j.marpolbul.2016.06.06
- Najem, J.S., Akle, B.J., Sarles, S.A. & Leo, D.J., 2011. Design and development of a biomimetic jellyfish robot that features ionic polymer metal composites actuators. ASME Conference on Smart Materials, Adaptive Structures and Intelligent Systems. https://doi.org/10.1115/smasis2011-5105
- Najem, J.S., Leo, D.J. & Sarles, S.A., 2012. Biomimetic jellyfish-inspired underwater vehicle actuated by ionic polymer metal composite actuators. Smart Materials and Structures, 21(9), 094026. https://doi.org/10.1088/0964-1726/21/9/094026
- Nurul Izzah, A., Wan Rozita, W.M., Tengku Rozaina, T.M., Cheong, Y.L., Siti Fatimah, N.S., Nasriyah, C.H., Nor Aini, A., Rafiza, S. & Lokman, H.S., 2016. Fish consumption pattern among adults of different ethnics in Peninsular Malaysia. Food & Nutrition Research, 60, 32697. https://doi.org/10.3402/fnr.v60.32697
- Phillips, D.J.H. & Rainbow, P.S., 1993. Biomonitoring of trace aquatic contaminants. Chapman & Hall.
- QGIS Development Team. (2024). QGIS Geographic Information System. Open Source Geospatial Foundation Project. http://qgis.org
- Purcell, J.E., 2012. Jellyfish and ctenophore blooms coincide with human proliferations and environmental perturbations. Annual Review of Marine Science, 4, 209–235. https://doi.org/10.1146/annurev-marine-120709-142751
- Rainbow, P.S., 2002. Trace metal concentrations in aquatic invertebrates: Why and so what? Environmental Pollution, 120(3), 497–507. https://doi.org/10.1016/S0269-7491(02)00238-5
- Razali, N.S.M., Ikhwanuddin, I., Maulidiani, M. & Idris, M.A., 2024. Ecotoxicological impact of heavy metals on wild aquatic species in river ecosystems. Science of the Total Environment, 946, 174210. https://doi.org/10.1016/j.scitotenv.2024.174210
- Sehrin, S., Palash, M.A.I., Ahmed, M.S. & Quraishi, M.A., 2025. Public health risk assessment and possible contamination sources of heavy metals in marine organisms. Journal of Hazardous Materials Advances, 17, 100568. https://doi.org/10.1016/j.hazadv.2024.100568
- Shafiuddin Ahmed, A.S., Sultana, S., Habib, A., Ullah, H., Musa, N., Hossain, M. B., Rahman, M. M., & Islam Sarker, M. S., 2019. Bioaccumulation of heavy metals in some commercially important fishes from a tropical river estuary suggests higher potential health risk in children than adults. PLoS ONE, 14(10), e0219336. https://doi.org/10.1371/journal.pone.0219336
- Talukder, R., Rabbi, M.H., Baharim, N.B. & Carnicer, R., 2022. Source identification and ecological risk assessment of heavy metals. Environmental Forensics. https://doi.org/10.1080/15275922.2021.1892871
- Tek, P.P.Y. & Ng, C.C., 2024. Accumulation of potentially toxic elements in seafood species: Implications for dietary safety. Environmental Monitoring and Assessment, 196(4), 382. https://doi.org/10.1007/s10661-024-12508-2
- Templeman, M.A. & Kingsford, M.J., 2012. Variation in soft tissue chemistry among scyphozoan jellyfish in different coastal environments. Hydrobiologia, 690(1), 279–290. https://doi.org/10.1007/s10750-012-1051-y
- Templeman, M.A., McKenzie, M.R. & Kingsford, M.J., 2021. The utility of jellyfish as marine biomonitors. Marine Pollution Bulletin, 173, 113056. https://doi.org/10.1016/j.marpolbul.2021.113056
- USEPA (United States Environmental Protection Agency). (2021). Regional Screening Levels (RSLs) for Chemical Contaminants. https://www.epa.gov/risk/regional-screening-levels-rsls
- Velayutham, R., Justin Raj, C., Thondaiman, P., Kale, A.M., Manikandan, R., Rodney, J.D., Choi, Y., Lee, Y.J., Kim, M., Moulton, S.E. & Kim, B.C., 2025. Construction of interfacial amorphous/crystalline multi-metal sulfide heterostructures and jellyfish-derived activated carbon for high-energy density hybrid pouch supercapacitors. Journal of Materials Science and Technology. https://doi.org/10.1016/j.jmst.2024.10.055
- WHO (World Health Organization), 1993. Guidelines for Drinking-Water Quality. Volume 1: Recommendations. 2nd ed. World Health Organization, Geneva.
- WHO (World Health Organization), 2008. Evaluation of certain food additives and contaminants: Sixty-seventh report of the Joint FAO/WHO Expert Committee on Food Additives (JECFA). WHO Press, Geneva.
- Xu, P., Akhadov, E.A., Wang, L. & Wang, H.L., 2011. Sequential chemical deposition of metal alloy jellyfish using polyaniline: Redox chemistry at the metal–polymer interface. Chemical Communications, 47, 8312–8314. https://doi.org/10.1039/c1cc13025k
- Yap, C.K. & Al-Mutairi, K.A., 2022a. Copper and zinc levels in commercial marine fish from Setiu, East Coast of Peninsular Malaysia. Toxics, 10(2), 52. https://doi.org/10.3390/toxics10020052
- Yap, C.K. & Al-Mutairi, K.A., 2022b. Comparative study of potentially toxic nickel and their potential human health risks in seafood (fish and mollusks) from Peninsular Malaysia. Biology, 11, 376. https://doi.org/10.3390/biology11030376
- Yap, C.K. & Al-Mutairi, K.A., 2023. Biomonitoring–health risk nexus of potentially toxic metals on Cerithidea obtusa: A biomonitoring study from Peninsular Malaysia. Foods, 12(8), 1575. https://doi.org/10.3390/foods12081575
- Yap, C.K., Austin Hew, T.Y., Nulit, R., Syazwan, W.M., Okamura, H., Horie, Y., Ong, M.C., Ismail, M.S., Kumar, K., Zakaly, H.M.H. & Cheng, W.H., 2024. Copper in commercial marine fish: From biomonitoring to the ESG (Environment, Social, and Governance) method. Pollutants, 4(1), 117–135. https://doi.org/10.3390/pollutants4010008
- Ye, J., Yao, Y.C., Gao, J.Y., Chen, S., Zhang, P., Sheng, L. & Liu, J., 2022. LM-jelly: Liquid metal enabled biomimetic robotic jellyfish. Soft Robotics, 9, 1175–1187. https://doi.org/10.1089/soro.2021.0055
- Yeom, S.W. & Oh, I.K., 2009. A biomimetic jellyfish robot based on ionic polymer metal composite actuators. Smart Materials and Structures, 18(8), 085002. https://doi.org/10.1088/0964-1726/18/8/085002
- Yulyana, A., Hastuti, A.A.M.B., Rohman, A. & Setiawan, F.A., 2023. Heavy metal levels in fish products in Indonesia. Food Research, 7(2), 74–83. https://doi.org/10.26656/fr.2017.7(2).727
- Zanuri, N.B.M., Abdullah, M.B., Darif, N.A.M. & Nik Wan, N.F., 2020. Case study of marine pollution in Teluk Bahang: Ecological impacts and mitigation strategies. IOP Conference Series: Earth and Environmental Science, 414(1), 012032. https://doi.org/10.1088/1755-1315/414/1/012032
- Zeng, H., Xu, X., Ding, M., Zhang, H., Jiang, Y. & Wang, S., 2024. Differential response of heavy metal accumulation in aquatic ecosystems. Environmental Pollution, 362, 124981. https://doi.org/10.1016/j.envpol.2024.124981
- Zhang, Y., Zhang, M., Yu, W., Li, J. & Kong, D., 2022. Ecotoxicological risk ranking of 19 metals in molluscs. Science of the Total Environment, 812, 152370. https://doi.org/10.1016/j.scitotenv.2021.152370