
1. INTRODUCTION
Soil erosion is considered a crucial environmental issue that affects water quality, agricultural productivity, and ecosystem health. It can be defined as the process by which soil and rock are removed from the Earth's surface by natural forces such as water, wind, ice, and gravity (Choorappulakkal et al., 2024). It has been extensively studied across different regions and scales throughout the world. In addition, it is highlighted as a significant issue globally, leading to sediment accumulation in river basins and reservoirs, reducing water storage capacity of dams, affecting power generation efficiency, and affecting irrigation facilities. Algeria, which is located in North Africa, is highly susceptible to soil erosion because of its arid and semi-arid climate, land cover, and steep topography. Ziadat et al. (2025) mentioned that more than 70 million hectares in the Arab region are affected by human-induced land degradation, of which over 46 million hectares correspond to agricultural land. Soil erosion is due primarily to deforestation, steep slopes, and climate factors, causing agricultural decline and dam silting especially in arid regions. According to Djoukbala et al. (2024), Soil erosion in the K’sob watershed has caused significant land degradation leading to dam silting. Their study revealed an average erosion rate of 7.83 t ha-1yr-1, which exceeds the threshold of 3 t ha-1yr-1 tolerated while a landscape remains sustainable. The Oued Sly watershed, which is located in Chlef province, is facing an average soil loss of 23.4 t ha-1yr-1, with severe erosion in steep, bare areas exceeding 125.64 t ha-1yr-1. Low to moderate erosion affects most of the area, while high and very high risks impact 9.24% of the region. Erosion has caused a 21.65% reduction in the Sidi Yacoub dam’s capacity, underscoring the need for reforestation and erosion control measures (Chaïeb et al., 2024). Numerous models have been developed to predict soil erosion rates, ranging from empirical to process-based models. The Universal Soil Loss Equation (USLE) and its revised version (RUSLE) are among the most widely used empirical models to estimate the soil erosion. The USLE model, developed by Wischmeier and Smith (1978), is an empirical model that estimates soil loss based on six factors: rainfall erosivity (R), soil erodibility (K), slope length and steepness (LS), cover management (C), and support practices (P). The RUSLE, an updated version of the USLE, incorporates additional factors and improved algorithms to enhance the accuracy of soil erosion predictions (Renard et al., 1997). Both models have been widely applied in several regions, including the Mediterranean basin, where soil erosion is a significant concern due to the climatic and topographic characteristics of the region (Alexandridis et al., 2015; Panagos et al., 2015). In addition, these models have been applied in various contexts such as agricultural lands, forests, and urban areas, to assess the impact of land use and management practices on soil erosion (Wischmeier and Smith, 1978; Renard et al., 1997). The Mediterranean region is particularly susceptible to soil erosion due to its semi-arid climate, long periods of drought, intense rainfall events, and fragile soils. Several studies have quantified soil erosion in this region using empirical and process-based models. Kouli et al. (2009) applied the RUSLE model to assess soil erosion in Crete (Greece), and found that land-use changes significantly influenced erosion rates. Similarly, Terranova et al. (2009) used the USLE model to evaluate soil erosion in southern Italy and emphasized the importance of vegetation cover in reducing erosion. Several studies have quantified soil erosion in different regions of Algeria using empirical models, including the USLE and RUSLE. Bouguerra et al. (2017) used RUSLE–GIS in the Bouhamdane watershed and identified steep slopes and low vegetation cover as the main drivers of high erosion-risk zones. Bouamrane et al. (2021) mapped RUSLE-derived hazard classes in the Mellah watershed and highlighted topography and vegetation cover as key determinants of hazard distribution, arguing for targeted conservation on steep, sparsely vegetated slopes. Medjani et al. (2023), utilized the USLE model integrated with GIS to assess soil erosion in the Mafragh watershed. This study underscores the importance of sustainable agriculture as 26% of the area faces moderate to severe erosion risks. Similarly, Housseyn et al. (2021) applied the RUSLE model in the Mellah catchment, revealing an average soil loss of 10.21 t ha-1yr-1 and the variability of erosion risks due to climate change and rainfall fluctuations. A study on rainfall erosivity and sediment yield led by Guesri et al. (2020) for the K’sob watershed showed that episodic, high-intensity rainfall events increase annual soil loss. Belgherbi & Benabdeli (2021) quantified the severity of the erosion problem in the in western Algeria region, with soil losses reaching up to 61.22 t ha-1yr-1, which is considered very high and unsustainable.
Climate change is expected to exacerbate soil erosion in the Mediterranean region due to increased rainfall intensity and frequency of extreme weather events. Several studies have projected an increase in soil erosion rates under future climate scenarios, highlighting the need for adaptive management strategies to mitigate the impacts of climate change on soil erosion (Nunes et al., 2013; Ziadat and Taimeh, 2013). Land use and management practices play a crucial role in controlling soil erosion. Agricultural practices, such as tillage, crop rotation, and contour farming, can either exacerbate or mitigate soil erosion depending on their implementation. Several studies have highlighted the impact of land-use changes, such as deforestation and urbanization, on soil erosion rates in the Mediterranean region (García-Ruiz et al., 2015). Effective soil conservation practices, such as terracing, agroforestry, and the use of cover crops, have been shown to significantly reduce soil erosion in this region (Cerdà et al., 2010; Prosdocimi et al., 2016). This work emphasizes the importance of identifying erosion-prone regions and implementing effective measures to address erosion, particularly in Cheliff watershed, northern Algeria where soil erosion varies in intensity across different agro-climatic zones. Techniques like contour tillage and contour bunding are mentioned as sustainable land management practices to reduce water erosion on sloping farms and hilly terrain, respectively.
2. MATERIALS AND METHODS
2.1. Study area
The study area is a part of the Cheliff-Zahrez watershed, which represents over 22% of the surface area of northern Algeria. The Upper and Middle Cheliff basins are located between longitudes 1° and 3°90' to the east and latitudes 35° and 36°50' to the north, with a surface area of 10930 km². It comprises eleven sub-watersheds. Each sub-catchment can be described by a well-specified code, as shown in figure 1.
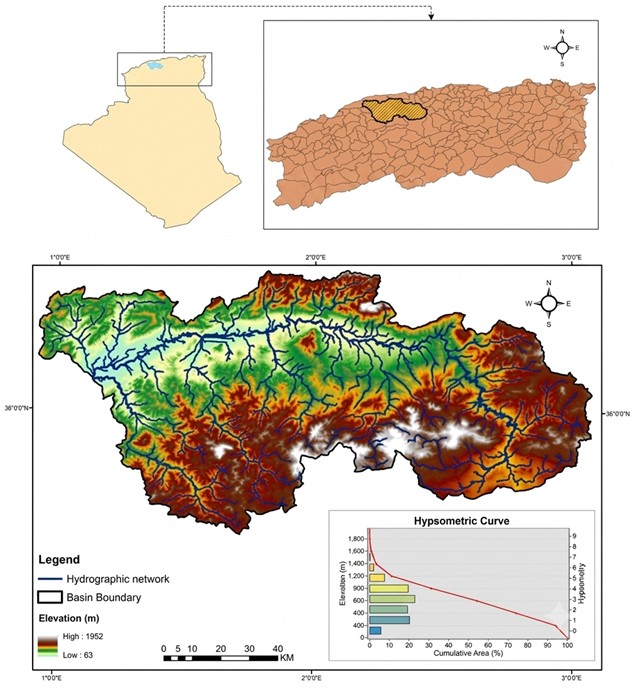
This basin has a very dense hydrographic network, with around 2200 km of permanent wadis and 5600 km of temporary wadis. The main river running through the study area over a length of 349 km is the Cheliff River (Chaïeb et al., 2024). The drainage density varies between 0.57 and 1.54 km/km². The low values characterize the low-slope terrain, which is mainly located on the high plains, resulting in low rainfall and significant permeability of the lithological structures.
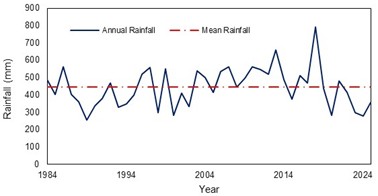
The average annual rainfall in the study area is about 378 mm. More than 98% of the precipitation falls between September and May. In autumn and winter, the area receives an equal amount of rain. Nevertheless, the seasonal distribution is rather irregular because it rains half as much in spring as in winter. Furthermore, summer precipitation is significantly lower, accounting for only 6% of the total average annual precipitation (Figure 2).
The Upper and Middle Cheliff regions are located in the semi-arid bioclimatic zone. This zone is characterized by cold, wet winters and hot, dry summers, with winter temperatures ranging from 0°C to 6°C and summer temperatures from 32°C to 36°C.
2.2. Methodology
The USLE model has been integrated into a geographic information system (GIS). All thematic maps of factors affecting water erosion were developed on an existing database.
The Universal Soil Loss Equation (USLE) was used to estimate soil erosion rates. The model, proposed by Wischmeier and Smith (1978), estimates soil loss in t ha-1yr-1 at the pixel scale. This empirical model expresses soil loss as a function of multiple factors, each integrated with GIS spatial data for analysis (Equation 1):

Where A: estimated soil loss (t ha-1yr-1), R: rainfall erosivity factor, K: soil erodibility factor, LS: topographic factor (slope length and steepness), C: cover management factor and P: conservation practice factor.
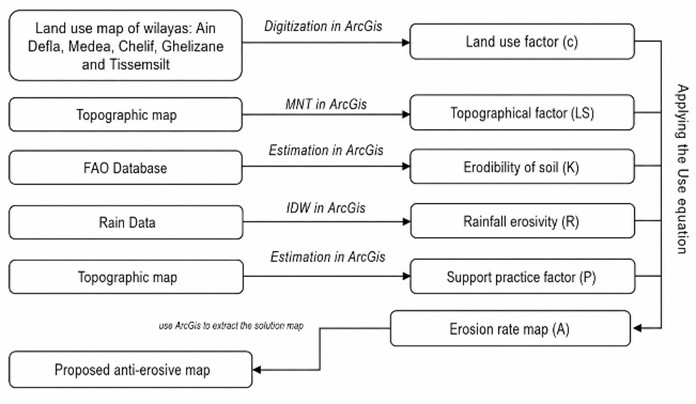
The purpose of this study is to assess the soil erosion in the Upper and Middle Cheliff watershed using GIS and remote sensing technologies. A Digital Elevation Model (DEM) (30m) from SRTM data (Asf daac, 2023) was used to calculate topographic parameters and define the watershed boundaries. Soil erodibility was derived from the FAO/UNESCO soil map (FAO,2023), while rainfall data for 40 years of observation were used to calculate the rainfall erosivity factor using ArcGIS. The cover management factor (C-factor) was calculated using ArcGIS after digitizing land use maps from the provinces of Ain Defla, Medea, Chelif, Relizane, and Tissemsilt (Bneder, 2011). In the absence of erosion control measures, the support practice factor (P-factor) was set to 1 (Figure 3).
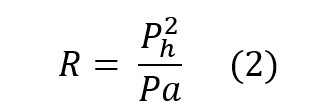
Due to the lack of precipitation gauges for measuring rainfall duration and intensity, the initial method for evaluating the climatic aggressiveness factor (R) was not feasible. Instead, Fournier’s approach, which relates climatic aggressiveness to the average monthly precipitation of the wettest month (Ph) and the average annual precipitation (Pa), was used as an alternative method (Soutter et al., 2007).
Arnoldus (1977) modified Fournier's equation by adding a monthly climatic index and summing the values to get a climatic coefficient. This "modified Fournier index" has been widely employed in FAO research, particularly in the Mediterranean region.
Therefore, for the current research, only the average annual and monthly precipitation data from each station (Equation 3) were used to determine the relative climatic aggressiveness for each station (17 stations).
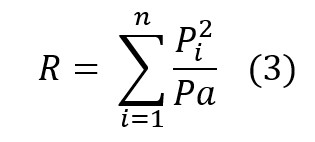
Where Pi is the average monthly precipitation (mm) and Pa is the average annual precipitation (mm).
The soil erodibility factor (K) represents its susceptibility to water erosion and depends on its intrinsic properties, including texture, structure, and permeability. It is determined experimentally for a given soil sample using the formula developed by Wischmeier and Smith (1978) (Equation 4 and 5).


Where Vfs: Fine sand fraction, Si: Silt fraction, C: Clay fraction, am: Percentage of organic matter in the soil sample, cs: Structure code of the soil sample, bp: Permeability code of the soil sample.
In this case, data from the FAO's global database of topsoil were used to extract a map of the Upper and Middle Cheliff watershed area (Table 1).
Table 1. K Factor from Harmonized World Soil Database (HWSD) (FAO, 2023).
|
ID |
Sand (%) |
Silt (%) |
Clay (%) |
TOC (%) |
K factor |
Soil Texture |
|
320 |
35 |
54 |
11 |
1.2 |
0.35 |
Silty |
|
1078 |
74 |
16 |
10 |
1.04 |
0.05 |
Loamy |
|
1117 |
25 |
54 |
21 |
1.6 |
0.35 |
Silty |
|
1118 |
42 |
38 |
20 |
1.06 |
0.34 |
Loam |
|
1127 |
34 |
41 |
25 |
1.64 |
0.34 |
Loam |
|
1238 |
23 |
54 |
23 |
2.09 |
0.34 |
Silty |
|
1344 |
13 |
42 |
45 |
2.1 |
0.27 |
Clay |
|
1413 |
19 |
37 |
44 |
2.44 |
0.24 |
Clay |
|
1416 |
76 |
16 |
8 |
1.93 |
0.05 |
Loamy |
The LS factor quantifies the influence of slope length and steepness on soil erosion. Its calculation begins with mapping the slope using a digital terrain model derived from the digitized topographic map of the area. The LS factor is then determined using a specialized formula (Moore and Burch, 1986) within Geographic Information Systems (GIS) (Equation 6).

The C factor indicates the ratio of soil erosion from land covered with vegetation compared to that from exposed soil. It varies based on factors such as crop type, rotation, density of vegetation, and stage of growth, evaluating the extent to which vegetation safeguards the soil from rainfall, especially during the wet season. To determine this factor, it was necessary to obtain land use maps for every area where we utilized the USLE equation. We categorized the types of land use based on the different divisions in the area by replotting the complete map using ArcGIS. Due to the existence of eleven sections, the factor value in each portion ranged from 0 to 1, thereby indicating that a value of 1 represents low resistance to erosion.
Table 2. The C factor values chosen for the Upper and Middle Cheliff watershed (Gisbert et al., 2012).
|
Land cover |
C Factor |
|
Tree crop farming |
0.1 |
|
Market gardening |
0.5 |
|
Built-up area |
0 |
|
Forest - Scrubland - Reforestation |
0.01 |
|
Rain-fed large-scale farming |
0.58 |
|
Olive farming |
0.65 |
|
Water body |
0 |
|
Mixed farming |
0.4 |
|
Viticulture |
0.54 |
|
Grazing area |
0.425 |
|
Bare land |
0.825 |
Soil conservation practices such as contour farming, terracing, and reforestation significantly reduce erosion, with values of P factor (Table 3) ranging from 1 (no conservation) to lower values depending on the method and slope. In the absence of erosion control practices. Shin’s method (1999) and GIS were used to create an erosion map for the upper and middle Cheliff basin.
Table 3. Values of P factor.
|
Slope (%) |
Reshaping |
Strip Cropping |
Terracing |
|
0.0 – 7.0 |
0.55 |
0.27 |
0.10 |
|
7.0 – 11.3 |
0.60 |
0.30 |
0.12 |
|
11.3 – 17.6 |
0.80 |
0.40 |
0.16 |
|
17.6 – 26.8 |
0.90 |
0.45 |
0.18 |
|
>26.8 |
1.00 |
0.50 |
0.20 |
3. RESULTS
3.1. R factor
The distribution of the rainfall erosivity factor R in the upper and middle Cheliff watershed (Figure 4) shows a clear trend of increasing values from south to north.
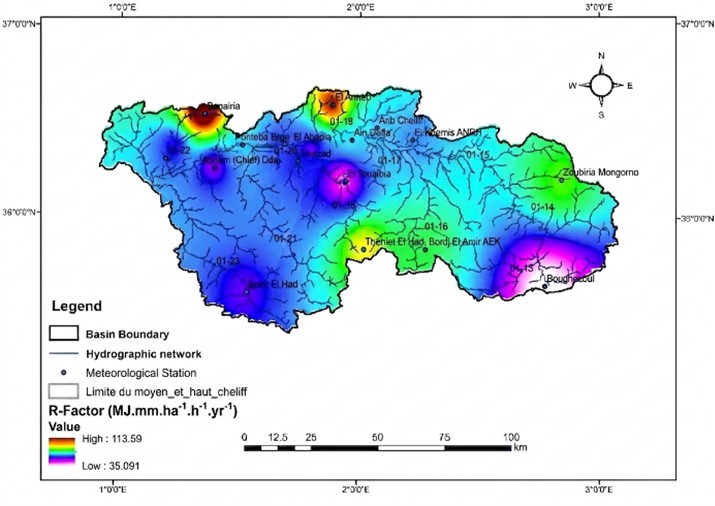
Rainfall is a major factor that affects soil erosion. The amount and intensity of rain determine how soil particles detach and move. High-intensity storms create strong raindrop impacts and surface runoff. These conditions speed up the movement of sediment downhill and into river channels. To measure this effect, rainfall records from 17 monitoring stations were examined across the study area. They calculated rainfall erosivity (R-factor), which shows how rainfall can cause erosion by looking at total precipitation, storm duration, and rainfall intensity. The differences in erosive potential between the monitoring stations show significant variability. Some areas have consistently higher R-values due to frequent heavy rainfall. This variability helps us understand how different sub-watersheds are prone to erosion. It also emphasizes the need for tailored soil conservation efforts in each region.
3.2. K factor
The erodibility factor indicates how raindrops affect soil structure, which varies by region. To assess this factor, soil analyses are typically required. Five distinct values were identified, with higher values correlating to greater erosion effects from rainfall (Figure 5).
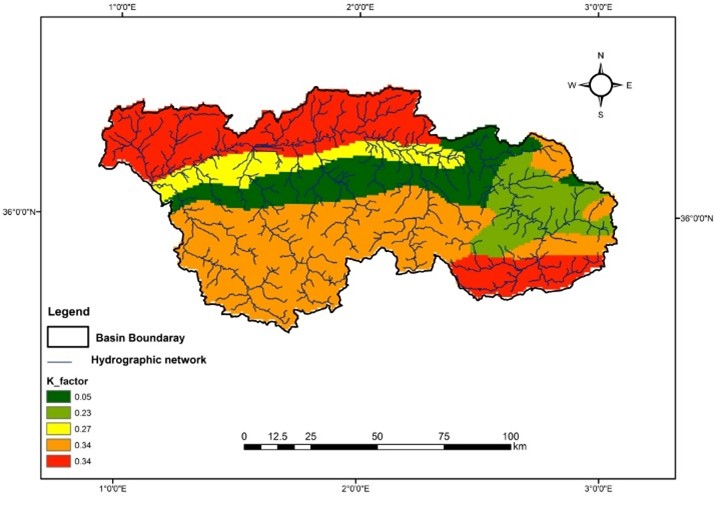
The soil erodibility factor (K) in the Upper and Middle Cheliff watershed has an average value of 0.246. This value is relatively high compared to global averages for similar semi-arid areas. It indicates that soils in this region are more likely to be detached and moved by erosive rainfall. The K values vary across the watershed, ranging from 0.05 to 0.34. The lowest values are mainly found in the central part, associated with coarse-textured soils that have higher sand content. These soils allow more water to seep in and reduce surface runoff, which limits erosion risk, even though they are less stable when in aggregate form. In contrast, higher K values occur in fine-textured soils rich in silt and organic matter. While these soils are more fertile, they are also more vulnerable to erosion because they are weaker against the impact of raindrops. This variation in K values highlights the complicated relationships between soil texture, structure, organic matter, and permeability. All these factors influence how soils respond to erosive forces. Understanding this variation is key for creating focused management strategies, such as targeted reforestation or improving soil cover in areas with high erodibility. These efforts can reduce erosion risks and help maintain the long-term productivity of the watershed.
3.3. LS factor
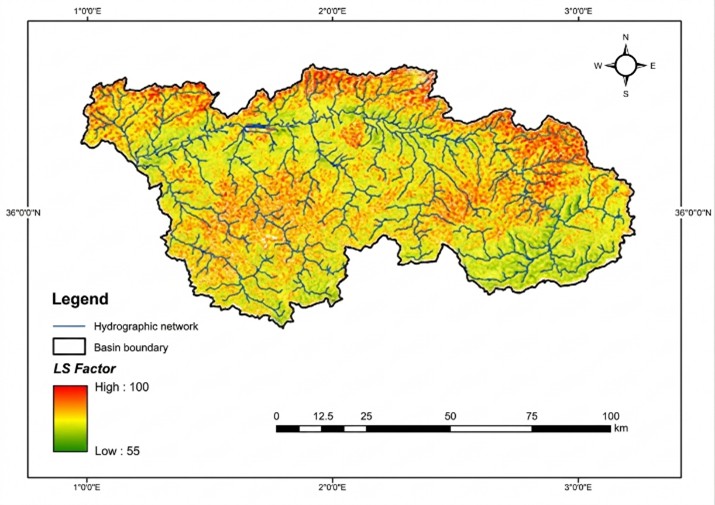
Using the specialized formula within Geographic Information Systems (GIS), have come to the estimation of topographic LS Factor between 55 and 100 (Figure 6).
Higher soil loss values are found mainly in the northern and southern parts of the Middle Cheliff watershed. Steep slopes increase the erosive impact of rainfall and runoff in these areas. In particular, the mountainous terrain of Zakar faces severe erosion due to a combination of steep gradients, shallow soils, and sparse vegetation. The steep landscape quickens overland flow, which raises both the speed and transport capacity of runoff. This process results in greater soil detachment and more sediment carried downstream. In contrast, flatter regions like the Khemis Meliana plain show much lower soil loss values. Gentle slopes lead to higher infiltration rates, slower runoff, and more chances for sediment to settle. This difference highlights how topography significantly affects erosion, with slope length and gradient playing key roles in soil stability.
3.4. C factor
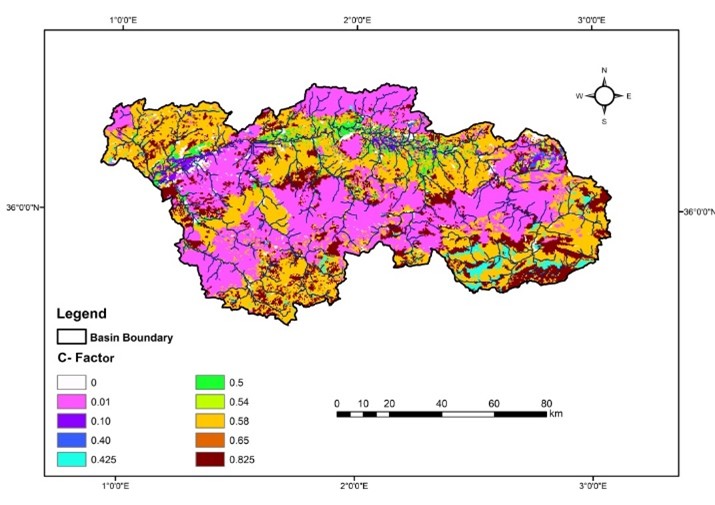
Land use maps were created with Geographic Information Systems (GIS) to apply the USLE equation, dividing the area into 11 sections. The factor values varied between 0 and 1, with higher values representing lower erosion resistance.
The spatial distribution of C-factor values in Figure 7 shows how land cover and vegetation affect soil erosion control across the watershed. About 59.86% of the area has a low erosion risk, with C-factor values between 0 and 0.10. This indicates healthy vegetation such as forests and dense shrublands that protect the soil from raindrop impact, improve infiltration, and slow down surface runoff. Approximately 15% of the watershed has a moderate erosion risk, with C-factor values ranging from 0.40 to 0.425. This risk is usually found in transitional land uses where partial ground cover provides limited soil protection. Another 15% of the watershed is classified as high risk, with C-factor values between 0.50 and 0.65. These areas typically have sparse vegetation and agricultural practices that leave soils exposed for long periods. The remaining 5% falls into the very high-risk category, with C-factor values near 0.825. These zones include overgrazed pastures, fallow lands, and severely degraded hillslopes.
3.5. P factor
The conservation practice factor erosivity factor reflects the impact of natural or human forces on soil. In undisturbed regions, such as the northeast of Ain Defla and southwest of Tissemsilt, the P factor is closer to 1. Conversely, in agricultural areas subject to human activities, the erosivity factor is lower, which helps reduce soil erosion rates. This pattern is clearly observed in the soil erosivity map.
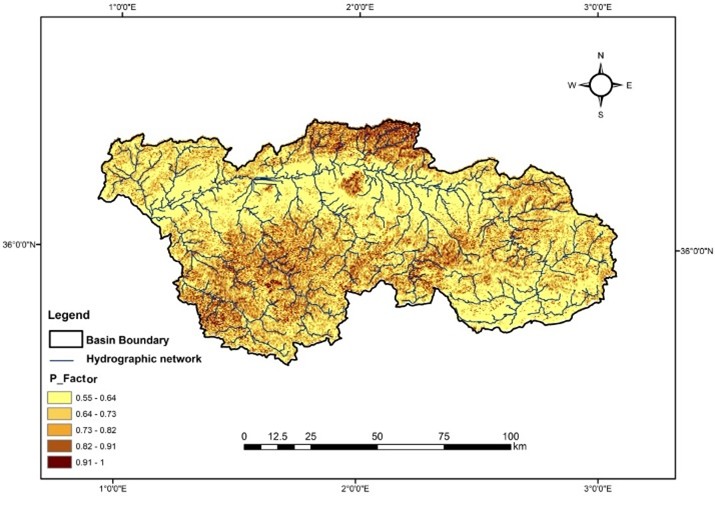
The spatial distribution of the P-factor, shown in Figure 8, illustrates how effective erosion control practices are across the watershed. Most of the basin has relatively low P-factor values that range from 0.55 to 0.64. Moderate P-factor values, which range from 0.64 to 0.82, cover significant parts of the watershed. In contrast, high P-factor values from 0.82 to 1 are found in specific areas. These areas, especially along drainage networks and in regions with heavy land use, have lost their natural vegetation.
3.6. Soil erosion
By applying the USLE equation within the Geographic Information Systems (GIS) program, we created an illustrative map of the erosion potential in the Upper and Middle Cheliff area. As a result, we obtained the following map (Figure 9), which shows the regions that are susceptible to erosion on an annual basis.
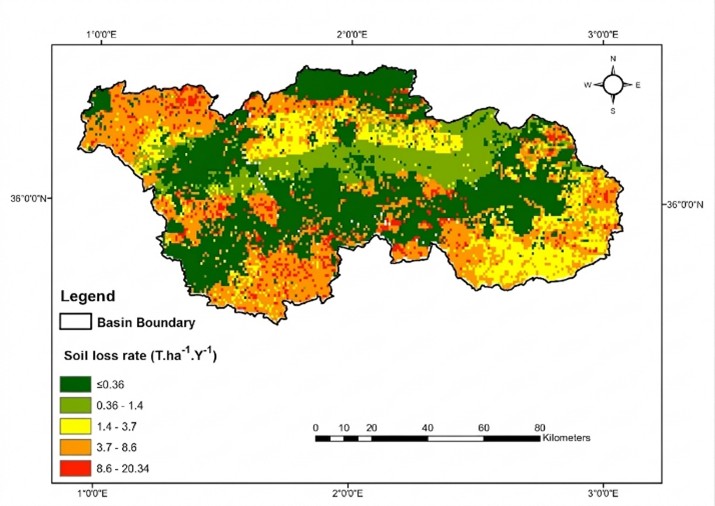
Following a thorough analysis of each factor, we employed the USLE equation within Geographic Information Systems (GIS) to create our ultimate erosion map, thereby fulfilling the main objective of this research. The findings were classified into five separate degrees of potential water erosion:
The most common erosion levels in the central Upper and Middle Cheliff watershed range from 0 to 1.83 t ha-1yr-1. This is mainly because of gentle slopes, extensive forest cover, low rainfall, and some untouched areas. Erosion rates gradually increase from 1.83 to 4.62 t ha-1 yr-1 near the Oued Cheliff waterway, which includes Khemis Miliana in Ain Defla and parts of Medea. This rise is due to soil exposure and precipitation. Higher erosion, between 4.62 and 7.33 t ha-1 yr-1, occurs in northern Ain Defla near Mount Zakar and extends northeast to Chlef and Tissemssilt. Steep slopes and limited vegetation increase water erosion in these areas. Rates between 7.33 and 11.31 t ha-1 yr-1 are seen in the elevated regions of Chlef and Tissemssilt. This level of erosion causes serious soil loss that threatens nearby dams and leads to sedimentation. The steep terrain makes it harder to control erosion. The highest erosion levels, from 11.31 to 20.33 t ha-1yr-1, show severe soil loss in various parts of the study zone. This is related to steep slopes and sparse vegetation, which pose significant risks to dams, even though they are not widespread.
The five classes were defined using the Natural Breaks (Jenks) optimization method (Jenks, 1967; Jenks & Caspall, 1971), which groups erosion rates at natural discontinuities in the frequency distribution, minimizing within-class variance and maximizing between class variance. Each class corresponds to a distinct geomorphic setting in the Cheliff basin, from stable forested interfluves (Class 1: 0–1.83 t ha-1yr-1) to critical erosion hotspots threatening downstream dams (Class 5: 11.31–20.33 t ha-1yr-1).
Five classes were retained in accordance with FAO/WMO erosion severity guidelines, ensuring comparability with regional studies while preserving the distinction between dam-threatening levels (Classes 4–5) and lower-risk zones.
Considering our findings and the insights acquired in recent years, we have suggested measures to mitigate water erosion by area, using the erosion map (Figure 10) as a reference.
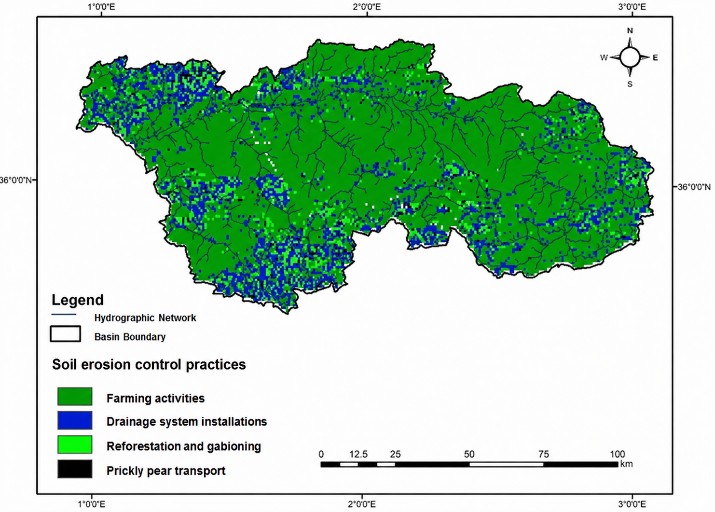
Areas with erosion levels between 0 and 4.62 t ha-1yr-1 are normal and show minimal soil loss. It is important to protect existing vegetation from seasonal crops for sustainability. Zones with erosion rates between 4.62 and 7.33 t ha-1yr-1 lose soil mainly due to water erosion. To tackle this issue, installing drainage systems can direct rainwater into valleys and reduce runoff that carries soil to rivers and dams. Regions with erosion levels from 7.33 to 11.31 t ha-1yr-1 deal with challenges from steep slopes and poor vegetation cover. This situation can be improved by reforesting bare areas and building gabions along rivers and streams to stabilize the soil. The highest erosion levels, ranging from 11.31 to 20.33 t ha-1yr-1, occur on steep slopes where significant soil loss takes place. Although it can be hard to find suitable plants, resilient species like prickly pear cactus may thrive in these conditions and help protect the soil.
4. DISCUSSIONS
The findings of this study indicate that soil erosion in the Upper and Middle Cheliff watershed reaches a maximum of 20.33 t ha-1yr-1, a value that aligns closely with the 'moderate to severe' degradation patterns observed across the Mediterranean basin (Zante et al., 2003). When compared to global averages for arable land, which typically range between 12 and 15 t ha-1yr-1 (Morgan, 2005), the peak rates in the Cheliff region are significantly higher, reflecting the fragile equilibrium of semi-arid ecosystems. Beyond the Mediterranean context, our results mirror those found in the semi-arid Sertão of Brazil, where GIS-based USLE assessments report losses of 18–25 t/ha/year due to similar high-intensity rainfall events (Silva et al., 2021). However, these findings remain conservative compared to the Loess Plateau in China, where extreme erodibility of silt deposits can drive rates exceeding 100 t ha-1yr-1 (Fu et al., 2011). Regionally, our results are highly consistent with studies in the Wadi Mina basin of Algeria (16.69 t ha-1yr-1) and central Tunisian watersheds, where rates frequently exceed 20 t ha-1yr-1 under comparable climatic pressures (Meddi et al., 2016). Conversely, our recorded maximum is lower than the extreme rates of 30–60 t ha-1yr-1 found in the Rif Mountains of Morocco (Sadiki et al., 2012) or the 40 t ha-1yr-1 in the neighboring Oued Sly, a variation primarily attributed to the 'gentle slopes' and 'extensive forest cover' identified in parts of the Upper Cheliff which act as a natural buffer. Nevertheless, since the recorded 20.33 t ha-1yr-1 far exceeds the internationally recognized 'Tolerable Soil Loss' threshold of 1–5 t ha-1yr-1 (Wischmeier & Smith, 1978), the hotspots identified near Mount Zakar and Tissemssilt represent areas of irreversible degradation requiring immediate conservation intervention.
Despite the robustness of the USLE framework, results carry inherent uncertainty due to the use of input layers (R, K, LS, C, P) of varying spatial resolution and acquisition dates, which introduce positional errors when overlaid in GIS, particularly along steep slopes and land-use boundaries. The LS factor is especially sensitive to the resolution (Zhang et al., 2013; Desmet and Govers, 1996), while C factor classification uncertainty further propagates through the model. Consequently, absolute erosion values in Classes 4 and 5 should be treated as indicative estimates, with spatial patterns and relative severity rankings being more reliable than exact class thresholds. Future work should harmonize input data to a common resolution and validate outputs against field measured sediment yields at the sub-basin scale.
5. CONCLUSIONS
This study provides a comprehensive evaluation of soil erosion in the Upper and Middle Cheliff watershed, integrating the Universal Soil Loss Equation (USLE) with Geographic Information Systems (GIS). The results highlight substantial spatial variability in erosion risks, ranging from negligible in flat, well-vegetated areas to severe in steep, barren terrains. The highest annual soil loss rates exceed 20.33 t ha-1yr-1, posing significant threats to agricultural productivity, water quality, and dam storage capacity. The research emphasizes the critical need for proactive soil conservation strategies. Priority measures include reforestation, contour farming, and the construction of gabions to stabilize soil and mitigate sediment transport. Implementing effective drainage systems in agricultural zones will further reduce runoff-driven erosion. The study also recognizes the value of climate-resilient vegetation, such as prickly pear cactus, for protecting highly vulnerable slopes. By mapping and quantifying erosion across this vast and diverse watershed, this work equips policymakers and land managers with essential insights for developing targeted, sustainable erosion control strategies. These efforts are vital for preserving soil health, ensuring sustainable agriculture, and protecting water resources in Algeria’s semi-arid regions.
REFERENCES
- Alexandridis, T. K., Sotiropoulou, A. M., Bilas, G., Karapetsas, N., & Silleos, N. G., 2015. The effects of seasonality in estimating the C-factor of soil erosion studies. Land Degradation & Development, 26(6), 596-603. https://doi.org/10.1002/ldr.2223
- Asf daac. (2023). ALOS PALSAR High Resolution Radiometric Terrain Corrected Product [Data set]. NASA Alaska Satellite Facility Distributed Active Archive Center.
- Arnoldus, H. M. J., 1977. Methodology used to determine the maximum potential average annual soil loss due to sheet and rill erosion in Morocco. In FAO Soils Bulletin (Vol. 34, pp. 39–51). Rome: Food and Agriculture Organization of the United Nations.
- Belgherbi, B., & Benabdeli, K., 2021. Spatial Analysis of Erosion and Quantification of Soil Losses in Western Algeria. Ekológia (Bratislava), 40(2), 130‑136. https://doi.org/10.2478/eko-2021-0015
- Bneder 2011. Land use and land cover map of the Wilaya of Ain Defla, Medea, Chelif, Relizane, and Tissemsilt [Map]. National Bureau of Studies for Rural Development, Ministry of Agriculture and Rural Development, Algiers, Algeria.
- Bouamrane, A., Bouamrane, A., & Abida, H., 2021. Water erosion hazard distribution under a Semi-arid climate Condition: case of Mellah Watershed, North-eastern Algeria. Geoderma, 403, 115381. https://doi.org/10.1016/j.geoderma.2021.115381
- Bouguerra, H., Bouanani, A., Khanchoul, K., Derdous, O., & Tachi, S. E., 2017. Mapping erosion prone areas in the Bouhamdane watershed (Algeria) using the Revised Universal Soil Loss Equation through GIS. Journal of Water and Land Development, 32(1), 13-23. https://doi.org/10.1515/jwld-2017-0002
- Cerdà, A., Giménez-Morera, A., & Bodí, M. B., 2010. Soil and water losses from new citrus orchards growing on sloped soils in the western Mediterranean basin. Earth Surface Processes and Landforms, 35(10), 1231-1240. https://doi.org/10.1002/esp.1889
- Chaïeb, F., Bouderbala, A., & Hamoudi, A. S., 2024. Soil erosion analysis with GIS: A case study of Oued Sly catchment, Northern Algeria. Annals of Arid Zone, 63(3), 117‑123. https://doi.org/10.56093/aaz.v63i3.148713
- Choorappulakkal, J., Jaglan, P., Kaushal, S. & Shubham, 2024. Comprehensive Assessment of Soil Erosion using USLE and Sustainable Management Strategies. Asian Journal of Soil Science and Plant Nutrition, 10(4), 463–473. https://doi.org/10.9734/ajsspn/2024/v10i4420
- Desmet, P. J. J., & Govers, G., 1996. A GIS procedure for automatically calculating the USLE LS factor on topographically complex landscape units. Journal of Soil and Water Conservation, 51(5), 427–433. https://doi.org/10.1080/00224561.1996.12457102
- Djoukbala, O., Djerbouai, S., Alqadhi, S., Hasbaia, M., Benselama, O., Abdo, H. G., & Mallick, J., 2024. A geospatial approach-based assessment of soil erosion impacts on the dams silting in the semi-arid region. Geomatics, Natural Hazards and Risk, 15(1), 2375543. https://doi.org/10.1080/19475705.2024.2375543
- FAO, (2023). [Food and Agriculture Organisation] Harmonized World Soil Database (HWSD) Satellite Data.
- Fu, B. J., Liu, Y., Lu, Y. H., He, C. S., Zeng, Y., & Wu, B.F., 2011. Assessing the effectiveness of restoration preventive measures in the Loess Plateau of China. Environmental Management, 48(6), 1128-1139. https://doi.org/10.1007/s00267-011-9766-4
- García-Ruiz, J. M., Beguería, S., Nadal-Romero, E., González-Hidalgo, J. C., Lana-Renault, N., & Sanjuán, Y., 2015. A meta-analysis of soil erosion rates across the world. Geomorphology, 239, 160-173. https://doi.org/10.1016/j.geomorph.2015.03.008
- Gisbert Blanquer, J. M., Ibáñez Asensio, S., & Moreno Ramón, H., 2012. El factor C de la ecuación universal de pérdidas de suelo (USLE). Universitat Politècnica de València.
- Guesri, M., Megnounif, A., & Ghenim, A., 2020. Rainfall erosivity and sediment yield in Northeast Algeria: K’sob watershed case study. Arabian Journal of Geosciences, 13(7). https://doi.org/10.1007/s12517-020-5276-1
- Housseyn, B., Nekkache, G. A., Kamel, K., Hamza, B., & Salah-Eddine, T., 2021. Estimation of soil losses using RUSLE model and GIS tools: Case study of the Mellah catchment, Northeast of Algeria. Romanian Journal of Civil Engineering/Revista Română de Inginerie Civilă, 12(3). https://doi.org/10.37789/rjce.2021.12.3.2
- Jenks, G. F., 1967. The data model concept in statistical mapping. International Yearbook of Cartography, 7, 186–190.
- Jenks, G. F., & Caspall, F. C., 1971. Error on choroplethic maps: Definition, measurement, reduction. Annals of the Association of American Geographers, 61(2), 217–244.https://doi.org/10.1111/j.1467-8306.1971.tb00779.x
- Kouli, M., Soupios, P., & Vallianatos, F., 2009. Soil erosion prediction using the Revised Universal Soil Loss Equation (RUSLE) in a GIS framework, Chania, Northwestern Crete, Greece. Environmental Geology, 57(3), 483-497. https://doi.org/10.1007/s00254-008-1318-9
- Meddi, H., Meddi, M., & Al-Ansari, N., 2016. Hydrological and climate study of the central and western parts of the Algerian coast. Journal of Earth Sciences and Geotechnical Engineering, 6(4), 1-20.
- Medjani, F., Derradji, T., Zahi, F., Djidel, M., Labar, S., & Bouchagoura, L., 2023. Assessment of soil erosion by Universal Soil Loss Equation model based on Geographic Information System data: A case study of the Mafragh watershed, north-eastern Algeria. Scientific African, 21, e01782. https://doi.org/10.1016/j.sciaf.2023.e01782
- Moore, I.D. and Burch, G.J., 1986. Physical Basis of the Length-slope Factor in the Universal Soil Loss Equation. Soil Science Society of America Journal, 50: 1294-1298. https://doi.org/10.2136/sssaj1986.03615995005000050042x
- Morgan, R. P. C., 2005. Soil Erosion and Conservation. 3rd Edition, Blackwell Publishing, Oxford.
- NASA. (2026). NASA POWER Data. NASA POWER. https://power.larc.nasa.gov/data-access-viewer/
- Nunes, J. P., Seixas, J., & Pacheco, N. R., 2013. Vulnerability of water resources, vegetation productivity and soil erosion to climate change in Mediterranean watersheds. Hydrological Processes, 27(22), 3115-3134. https://doi.org/10.1002/hyp.6897
- Panagos, P., Borrelli, P., Meusburger, K., Alewell, C., Lugato, E., & Montanarella, L., 2015. Estimating the soil erosion cover-management factor at the European scale. Land Use Policy, 48, 38-50. https://doi.org/10.1016/j.landusepol.2015.05.021
- Prosdocimi, M., Tarolli, P., & Cerdà, A., 2016. Mulching practices for reducing soil water erosion: A review. Earth-Science Reviews, 161, 191-203. https://doi.org/10.1016/j.earscirev.2016.08.006
- Renard, K. G., Foster, G. R., Weesies, G. A., McCool, D. K., & Yoder, D. C., 1997. Predicting soil erosion by water: A guide to conservation planning with the Revised Universal Soil Loss Equation (RUSLE). USDA Agriculture Handbook, 703.
- Sadiki, A., Faleh, A., Navas, A., & Bouhlassa, S., 2012. Assessing soil erosion and sedimentation in the Western Rif (Morocco). Journal of Mountain Science, 9, 654-663. https://doi.org/10.1007/s11629-012-2432-6
- Shin, G. H., 1999. The use of GIS for the assessment of soil erosion risk in Korea. Geo Journal, 49(3), 287–295. https://doi.org/10.1023/A:1007025527516
- Silva, R. M., Santos, C. A. G., & Silva, V. C., 2021. Assessment of soil erosion and sediment yield in the Brazilian semi-arid region using the USLE model and GIS. Journal of Arid Environments, 188, 104470. https://doi.org/10.1016/j.jaridenv.2021.104470
- Soutter M., Mermoud A., Musy A., 2007. Ingénierie des eaux et du sol processus et aménagements [Water and Soil Engineering Processes and Facilities]. PPUR. Lausanne, Suisse. ISBN 2880747244 pp. 294.
- Terranova, O., Antronico, L., Coscarelli, R., & Iaquinta, P., 2009. Soil erosion risk scenarios in the Mediterranean environment using RUSLE and GIS: An application model for Calabria (southern Italy). Geomorphology, 112(3-4), 228-245. https://doi.org/10.1016/j.geomorph.2009.06.009
- Wischmeier, W. H., & Smith, D. D., 1978. Predicting rainfall erosion losses: A guide to conservation planning. USDA Agriculture Handbook, 537.
- Zante, P., Collinet, J., Le Bissonnais, Y., & Roose, E., 2003. Mapping soil erosion risk in the Mediterranean: The case of the Algerian coast. European Journal of Soil Science, 54, 1-12. https://doi.org/10.1016/S1164-6721(03)00003-7
- Zhang, H., Yang, Q., Li, R., Liu, Q., Moore, D., He, P., Ritsema, C. J., & Geissen, V., 2013. Extension of a GIS procedure for calculating the RUSLE equation LS factor. Computers & Geosciences, 52, 177–188. https://doi.org/10.1016/j.cageo.2012.09.027
- Ziadat, F. M., & Taimeh, A. Y., 2013. Effect of rainfall intensity, slope, land use and antecedent soil moisture on soil erosion in an arid environment. Land Degradation & Development, 24(6), 582-590. https://doi.org/10.1002/ldr.2239
- Ziadat, F., Conchedda, G., Haddad, F., Njeru, J., Brès, A., Dawelbait, M., & Li, L., 2025. Desertification and Agrifood Systems: Restoration of Degraded Agricultural Lands in the Arab Region. Agriculture, 15(12), 1249. https://doi.org/10.3390/agriculture15121249