
1. INTRODUCTION
Monitoring and analysis of hydrological parameters, carried out over time, have contributed to the development of international cooperation for understanding the evolution of the hydrological regime of the Danube River and Danube Delta.
In the last 25 years, the climatic changes have influenced the hydrological regime of the Danube Basin, as well as the ratio between the main branches of the Danube, within the delta and on the Sulina branch. The sediment accumulation on the river bed, taking place during long periods of droughts, could create serious problems for navigation, and could also decrease the flow circulation between the channels in the Danube Delta.
The sediments transported by the Danube River before discharged into the Black Sea, it represents the main driver that formed the Danube Delta. The activities of over 81 million people that living in the Danube River basin, greatly affect the natural environment of the basin, causing different categories of pressures, such as hydromorphological alterations (UNECE, 2007) and changes of sediment budget along the Danube River and in the Danube Delta.
In the Danube Delta, the hydromorphological and sedimentological processes are the result of a multiple series of anthropic works located in the Danube Basin, but also inside the delta. The cut-offs program of the Sulina and St. George branches brought a redistribution of water and sediment discharge among the main branches of the Danube Delta (Pojar et al., 2021; Panin, 1999). An important hydrotechnical dike, of 427 m long, was built in 19th century (Bondar & Panin, 2021), in the apex of Danube Delta (Figure 1), for water control during small waters, aiming to facilitate the navigation on the Sulina branch.
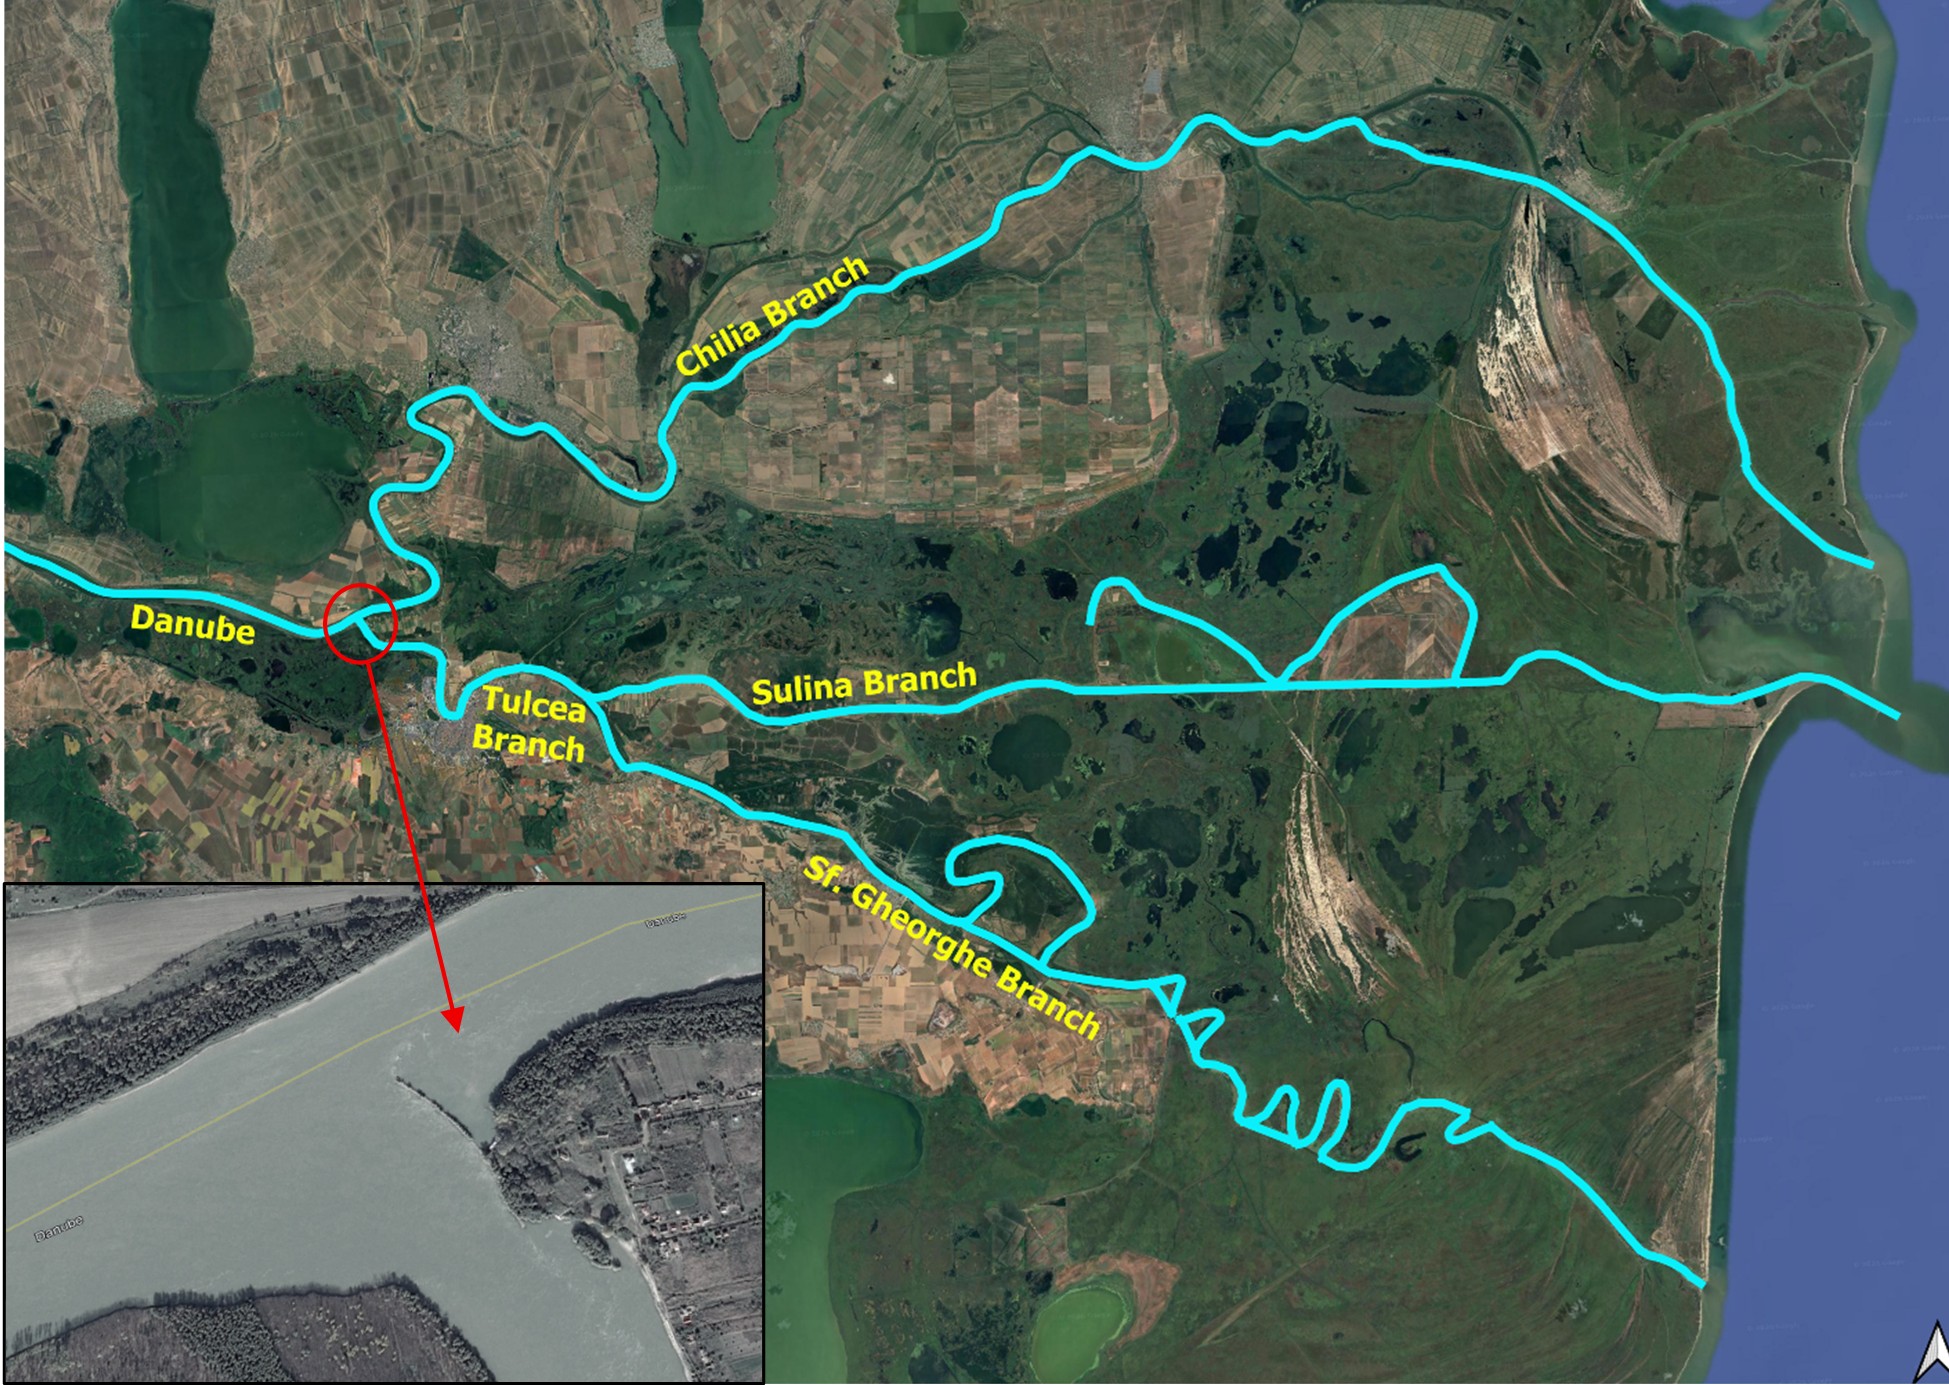
The importance of building the dike for the purpose of maintaining navigation on the Sulina branch has become much more relevant in recent years as the liquid flow along the Lower Danube has decreased, leading to smaller percentage distribution of the discharge through the north part of the delta (e.g. Chilia branch).
The objective of this study was to highlight the suspended sediment flux changes and the negative sediment budget that affect the Sulina branch, due to the modification of hydrological regime and the human interventions in the Danube Delta. The work addresses the issue of suspended sediments budget along the Sulina branch, which is of particular importance, due to its role, as the important navigation route. This aspect leads to frequent dredging activities, that are considered the main solution for keeping the fairway. In fact, an effective sediment management must be based on a comprehensive understanding of the suspended sediment system, including the accumulation / erosion processes.
1.1. Study area
The Danube Delta is a geographical unit undergoing continuous territorial evolution, resulting from the action of the river with its 6515 m³/s of water (multi-year average flow) and the sediment it carries, on the one hand, and the action of sea waves on the shore, on the other (Gastescu, 2010). The hydrological analysis was carried out on the Sulina branch (63.7 km length) which is considered the main international fairway to the Black Sea, being one of the main branches, of the Danube Delta (Figure 2).
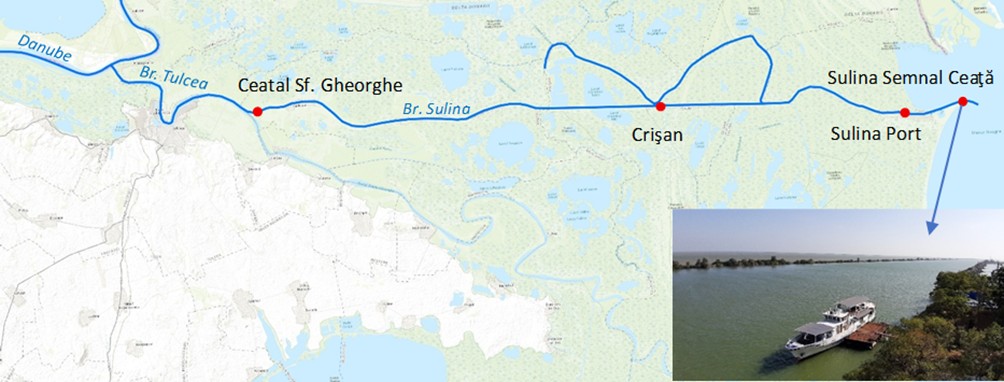
Several rectifications works (1856÷1907) and the embankment of Sulina branch for navigation purpose, influenced the speed of the Danube River and a direct consequence was an increase of the liquid flow between 1900 and 1960 and thus enhancing the sediment transport capacity (Bondar, 2010). The volume of water and alluvia drained increased from 7-8% to 18.8% of the Danube flow (Gastescu & Tuchiu, 2023). The expected outcome of these works was to exceed the length of the mouth bar (the main obstacle for navigation) into the Black Sea, by 8 km of dikes (Figure 2), and to cause the bar to form deeper into the sea, that influenced irreversible the sediment transport regime at the mouth of the branch and along the coastal area (Budileanu, 2013).
Over the past 25 years, on the Sulina branch, the maximum annual flow was recorded in the same year, 2006, both at the entrance (2690 m³/s at Ceatal Sf. Gheorghe hydrometric station) and at the mouth (3280 m³/s at Sulina Semnal Ceata hydrometric station), while the minimum annual flow was recorded differently, in different years.
The Danube Delta subsector, starts from the first Ceatal (bifurcation) where the Danube River splits into two branches (Chilia to the north and Tulcea to the south) to the second Ceatal, where it splits into the branches Sulina and Sf. Gheorghe.
2. MATERIALS AND METHODS
Analysis of long-term variability of the flows and suspended sediment loads, in the front of the Danube Delta and on the Sulina branch, was carried out by using time series (period 2000÷2024) of monthly and annual values, measured at the hydrometric stations (h.s.) from the national monitoring network, coordinated by NIHWM (National Institute of Hydrology and Water Management).
The hydrological data was obtained by daily monitoring of water level and “surface” suspended sediment concentrations near one bank. The “surface” concentrations are converted into cross-sectional average values, by applying empirical relationships obtained through complete measurements of water and sediment discharge. Daily values of suspended sediment discharges are obtained by average cross-sectional concentrations multiplied by the daily water discharge.
The hydrometric stations used in the study and their locations along the Danube River (Mm/km), are presented below (Table 1).
|
Table 1. Hydrometric stations used in the study. |
||
|
River |
Hydrometric stations |
River (Mm / km) |
|
Danube |
Ceatal Izmail |
43.5 / 80.5 |
|
Tulcea br. |
Ceatal Sf. Gheorghe |
37.0 / 68.5 |
|
Sulina br. |
Ceatal Sf. Gheorghe |
33.6 / 62.3 |
|
Sulina br. |
Crisan |
11.5 / 21.3 |
|
Sulina br. |
Sulina Port |
2.5 / 4.63 |
|
Sulina br. |
Sulina Semnal Ceata |
- / -7.2 |
Statistical computations were performed based on the liquid and sediments discharges recorded at the mouth (Sulina Semnal Ceata, h.s.) and the entrance (Ceatal Sf. Gheorghe, h.s.) of the branch, resulting in a coefficient (%) presented on an annual, seasonal, and monthly long-term basis for various time intervals. Also, differences between the suspended sediments loads of consecutive gauge stations, were computed for a detailed analysis of sediment budget along the Sulina branch.
In addition, other statistical analyses were performed using the TREND software (www.toolkit.net.au/trend), which is designed to facilitate statistical testing for trend, change and randomness in hydrological and other time series data. The software has 12 statistical tests, based on the WMO/UNESCO Expert Workshop on Trend/Change Detection and on the CRC for Catchment Hydrology publication Hydrological Recipes.
One of the nonparametric statistical methods, widely used in hydrology, such as the Mann-Kendall test, recommended also by WMO, was applied to the annual time series of the average liquid flow and of the average suspended sediment discharges. Statistical results of aforementioned time series of the hydrometric stations are presented in Table 2 and Table 3.
|
Table 2. Statistical summary of annual average flow (2000÷2024). |
||||||
|
Hydrometric stations |
mean |
median |
standard deviation |
z-value |
p-value |
trend |
|
Ceatal Izmail |
6340 |
6407 |
1209.03 |
-1.705 |
0.09 |
negative trend at 10% significance level |
|
Ceatal Sf. Gh./Tulcea |
3158 |
3054 |
568.82 |
-0.537 |
0.59 |
no trend |
|
Ceatal Sf. Gh./Sulina |
1250 |
1238 |
206.31 |
-2.125 |
0.03 |
negative trend at 5% significance level |
|
Crisan |
1140 |
1113 |
214.11 |
-2.382 |
0.02 |
negative trend at 5% significance level |
|
Sulina Port |
1229 |
1216 |
222.28 |
-1.471 |
0.14 |
no trend |
|
Sulina Semnal Ceata |
1085 |
1092 |
196.04 |
-0.701 |
0.48 |
no trend |
|
Table 3. Statistical summary of annual average suspended sediment discharges on the Sulina branch (2000÷2024). |
||||||
|
Hydrometric stations |
mean |
median |
standard deviation |
z-value |
p-value |
trend |
|
Ceatal Sf. Gheorghe |
89 |
77 |
43.47 |
-2.009 |
0.04 |
negative trend at 10% significance level |
|
Crisan |
77 |
57 |
50.50 |
-1.074 |
0.28 |
no trend |
|
Sulina Port |
68 |
59 |
38.45 |
0.28 |
0.78 |
no trend |
|
Sulina Semnal Ceata |
59 |
48 |
34.35 |
0.49 |
0.62 |
no trend |
According to the statistical results of p-value and z-value, presented in Table 2, the time series at the entrance to the delta (Ceatal Izmail h.s.) and at the beginning of the Sulina branch (Ceatal Sf. Gheorghe h.s. and Crisan h.s.) show significant statistical downward trends (90% confidence level for the entrance to the delta and 95% confidence level for the Sulina branch). At the same time, the p-value shows that there is no statistic significant trend for the annual average flow near the mouth of Sulina channel (at Sulina Port and Sulina Semnal Ceata monitoring stations). Concerning the annual average suspended sediment discharges, the Mann-Kendell statistical results (p-value and z-value), presented in Table 3, show significant statistical downward trend for the time series at the entrance to the delta (Ceatal Izmail h.s.). Instead, the data series of the monitoring stations along the Sulina branch show no statistic significant trend (p-value is greater than 0.10 significative level) and therefore, the observed variations are consistent with the natural variability of the data series.
3. RESULTS AND DISCUSSION
In front of the Danube Delta, at Ceatal Izmail node (Figure 3), the Danube’s flow is distributed differently between the Tulcea and Chilia branches, depending on the hydrological regime.
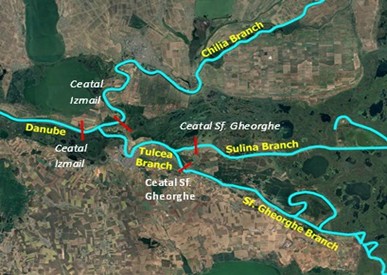
At high water levels and Danube’s flow, more than 8500 m3/s, approximatively, the distribution is nearly equal, but during small waters, due to the dike built in the front of the Danube Delta (Figure 1), almost 52% of the Danube’s flow, at Ceatal Izmail monitoring station, is carried by the Tulcea branch, towards the south part of the delta.
Downstream, at the hydrological knot of Ceatal St. Gheorghe, the flow distribution between Sulina and Sf. Gheorghe (Saint George) branches is unequal; over the past 25 years, the flow at the entrance to the Sulina branch represents approximatively 20% of the Danube’s flow, at Ceatal Izmail station (Figure 4). According to Gastescu (2009), who notes that rectification works, ongoing dredging, and bank reinforcement (necessary for maritime navigation) led to a stabilization of the flow distribution in the Sulina branch at 20.1% during the period 1991÷2000, our analysis shows that, over the past 25 years (2000÷2024) the ratio remained unchanged.
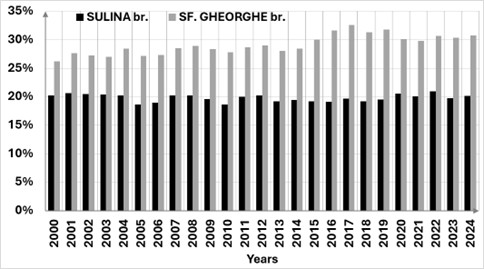
In the first period (2000÷2012), annual average flow of the Danube, near the main bifurcations, shows a greater variability (Figure 5) than in the second period (the last 12 years). The nonparametric Rank-Sum test (TREND software) showed that the medians for the 2000÷2012 period and the 2013÷2024 period are not significantly different.
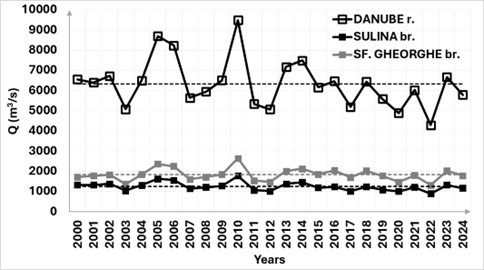
However, the entire time series is characterized by a downward trend (90% confidence level) determined using the non-parametric Mann-Kendall test.
Bondar & Iordache (2017) have analyzed the annual flows of the Danube River, at Ceatal Izmail station, for the period 1840÷2013 and they concluded that once every 10 years, annual discharges may increase or diminish by some 25% versus the long-time multiannual mean. During the last 25 years, the flows variation has changed in relation to the multiannual mean of the period 2000÷2024 and we identified that in the last 10 years (2015÷2024), the annual discharges increased maximum 10% and decreased almost 30% versus the multiannual mean of the last 25 years.
The increase in deviation from the long-term multiannual mean, representing lower annual average flows, is due to climate change, taken into consideration that the climatic factors (temperatures, precipitations, etc.) have large influence on the water discharge variation (Bondar & Iordache, 2017; Croitoru et al., 2022; Cretu et al., 2018).
The following section presents detailed analysis of flow and suspended sediments transport, as well as the assessment of the liquid and solid budget on the Sulina branch.
3.1. Water flow analysis
3.1.1. Evolution of water flow
A comparative analysis of water flow evolution, over last 25 years, was carried out, for all characteristic variables of Danube water (average, maximum and minimum flows), at yearly and monthly level, for the hydrometric stations located at the ends of Sulina branch (Ceatal Sf. Gheorghe h.s. vs. Sulina Semnal Ceata h.s.) (Figure 6).
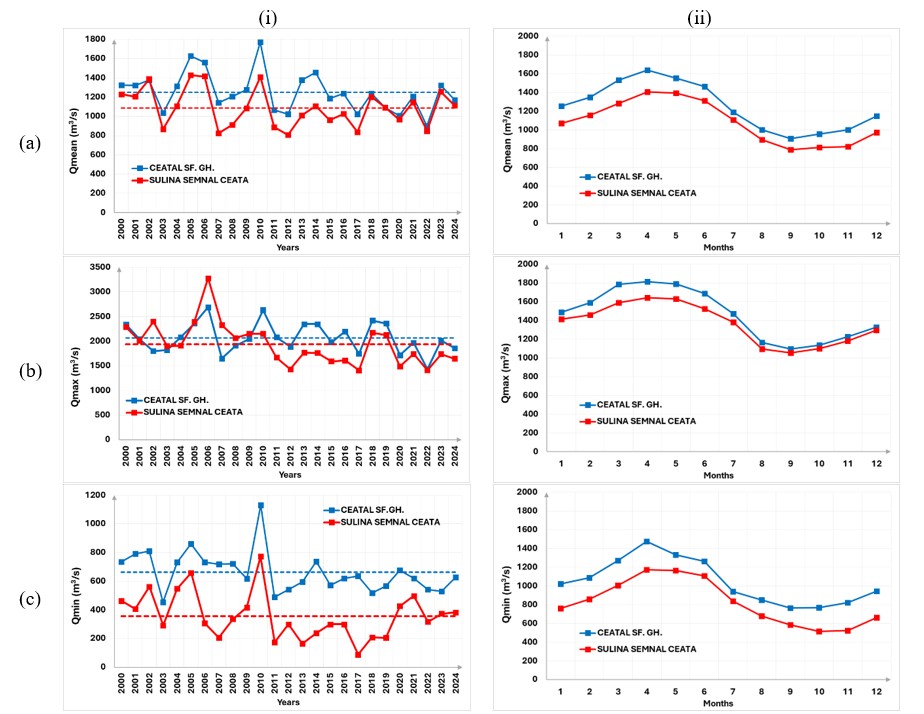
For the analyzed period, the average water flow in the front of Sulina branch, at Ceatal Izmail station, is 1250 m³/s and at the mouth of the channel to the Black Sea, is 1085 m³/s, which means that the difference of 165 m³/s between the two values or an annual average water volume of 5203 mil. m3 represents the supply of Danube Delta and the losses through evapotranspiration.
Along a year, the highest water flows carried out in April÷May months, while the lowest values were observed in October-November months.
For the entire analyzed period, the outflow water rates (OUT) are lower than the inflow rates (IN) on the Sulina branch, both on annual level and on monthly multiannual level. The higher difference between the values IN vs. OUT, carried out for “low water” hydrological conditions, during September-November period. This hydrological regime is characterized by lower Danube water velocities, favoring the sediment deposits at the junctions with adjacent channels in the delta, as well as higher summer temperatures and water evaporation, leading to a decrease in flow along the branch, toward the mouth of the river.
Other significant analysis was carried out for the annual average seasonal flow at the mouth of Sulina branch (Figure 7). Annual regime has slightly changed. On a seasonal level, the lowest runoff was identified in the autumn (SON - average of September, October and November), and the highest, in the spring (MAM - average of March, April and May), except for the years 2003, 2011 and 2024, when the extremes occurred in winter months.
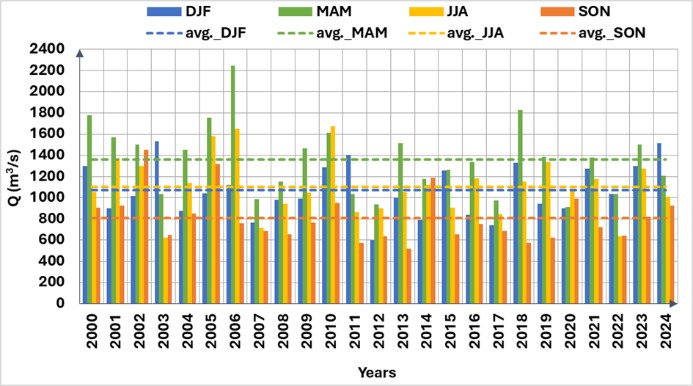
Summer (JJA - average of June, July and August) runoff is characterized by values smaller or close to the multiannual average seasonal discharges, while winter runoff (DJF - average of December, January and February) has very often values slightly higher than the multiannual average seasonal discharges. Comparing the multiannual average seasonal discharges for JJA (1105 m3/s) and DJF (1069 m3/s), it can be observed that they are very close.
3.1.2. Water budget
Water budget was analyzed based on the ratio between the outflow (OUT) rates from the Sulina branch and the inflow (IN) rates into that branch. The analysis was conducted on an annual basis, as well as monthly and seasonally, averaged over five-year intervals (2000÷2004, 2005÷2009, 2010÷2014, 2015÷2019, and 2020÷2024).
With regard to the annual variation in the water budget (Figure 8), the values remained below 100% throughout the entire period, with the exception of 2002 and 2019. As mentioned before, the period from 2002 to 2019 was marked by intervals with greater variability in flow rates and by multi-year cycles of dry and wet periods. The lowest ratio (OUT/IN), between 72% and 79%, were recorded in 2007, 2008, 2012, 2013 and 2014, on the Sulina branch.
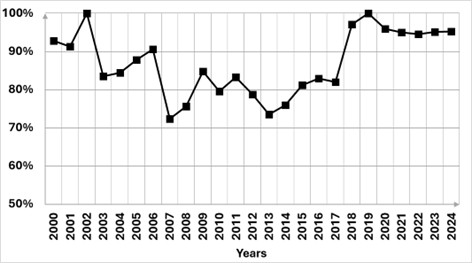
The lower the percentage, the lower the water budget transported into the Black Sea, through the Sulina branch. In this case, the water is released in the Delta and the discharge at the Sulina channel’s mouth is smaller, which is a favorable situation for the ecosystem situated in the vicinity of this branch (Trifu et al., 2022). According to Gheorghe et al. (2025) the changes of nutrients concentrations during 2020÷2023 in the lake Fortuna, located in the fluvial deltaic zone, may be linked to variations in water inflow from the Sulina branch, which influence both dilution capacity and the transport of nutrient-rich suspended matter.
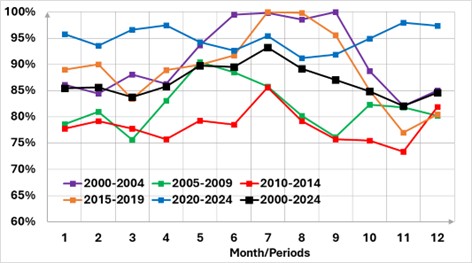
Monthly and seasonally flow rate, (OUT/IN) averaged over five-year intervals within the period 2000÷2024, are illustrated in Figure 9 and Figure 10.
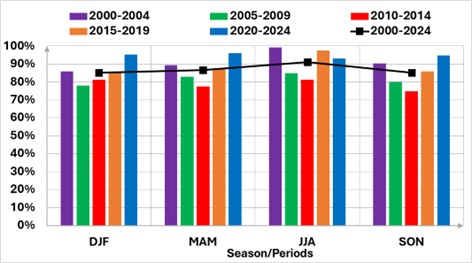
At seasonal level, the results show that in the last five years (2020÷2024), the flow rate has increased during winter, spring, and autumn, being higher than the multi-year seasonal budget.
Instead, the lowest values of the seasonal flow rate were recorded during the 2010÷2014 period, in spring, summer and autumn. It was also found that the periods with greater variability in the water budget were those in which discharges fluctuated more significantly, especially between April and September. These periods were identified as 2000÷2004, 2005÷2009, and 2015÷2019 (Figure 10).
Based on this analysis, our study shows that the period with the lowest multi-year monthly variability was between 2020 and 2024, with flow rates values ranging from 91% to 98%. Instead, the period 2000÷2004 recorded the highest intra-annual variability, with values ranging from 82% to 100%.
At the same time, the lowest flow rates (73%÷86%) were obtained in the 2010÷2014 period.
3.2. Suspended sediment transport analysis
3.2.1. Suspended sediment load
The most dynamic sector of the Sulina branch is the upstream part, due to the steep slope and the narrowing of the river bed. Under natural conditions, the transport of sediment through river runoff depends on a number of factors that finally generate the hydraulic energy or mechanical work performed by the water mass. This depends on the volume of water transported, the river’s gradient in its longitudinal profile, the fall of the watercourse over the analyzed river section, and the specific weight of the moving water mass (Zăvoianu, 2002).
The suspended sediment transport follows the same pattern of the water flow and depends on the characteristics of hydrological flow regime (higher values during April÷June and smaller values on September÷November). Variation of annual and multiannual monthly values of suspended sediment flows, between 2000 and 2024, was analyzed for the hydrometric stations located at the inlet and the outlet of the branch (Figure 11).
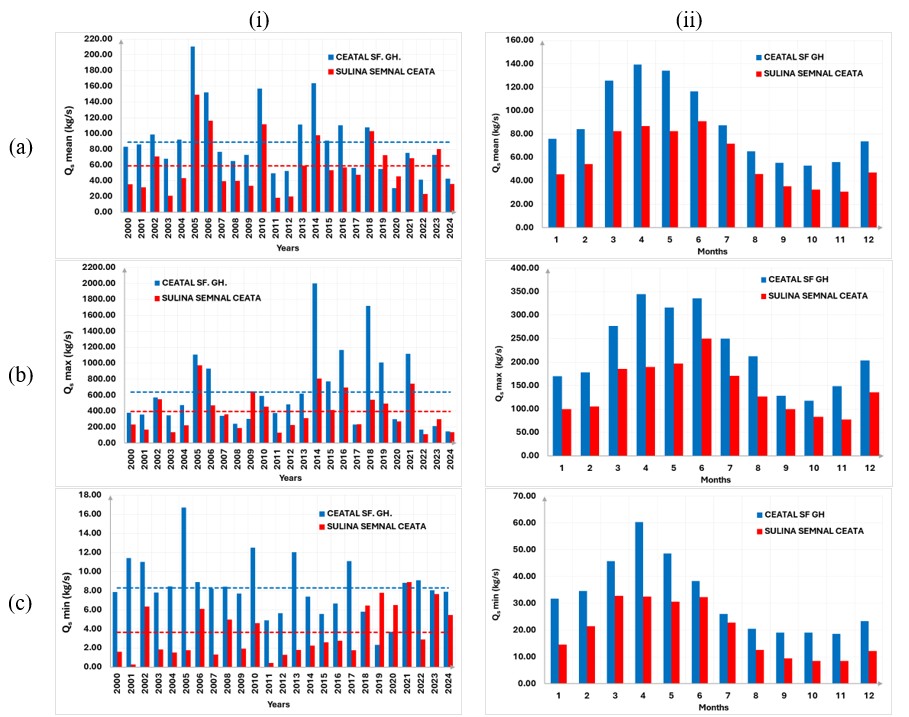
At the entrance to the Sulina branch the multiannual average suspended sediment load is 2.80 million tons/year (88.9 kg/s/year) and decreases along
the channel until the value of 1.86 million tons/year (58.9 kg/s/year), that means that almost 1 million tons/year of suspended sediment is accumulated along the branch and the adjacent channels within the delta.
A notable situation occurs in the case of the “low flows” hydrological regime. Thus, while the annual minimum suspended sediment discharges at the inlet of the branch show a decreasing trend, this is not the case at the Sulina mouth, where an increasing trend has been identified (Figure 11ic).
Our study shows that the differences between the inlet and outlet suspended sediment flow (IN < OUT) is opposite than in the water flow (IN > OUT).
The distribution of suspended sediment discharge indicates the influence of increased vessels traffic on the Sulina branch by the sediment resuspension (Stancu et al., 2024), intensification of dredging activities at the Sulina channel’s mouth, as well as the suspended sediment supply from the Black Sea.
Over the last 25 years (2000÷2024), the analyses of average seasonal suspended sediment loads were carried out for every year, at the mouth of the Sulina Branch (Sulina Semnal Ceata station). The evolution of these average annual seasonal values is illustrated in Figure 12.
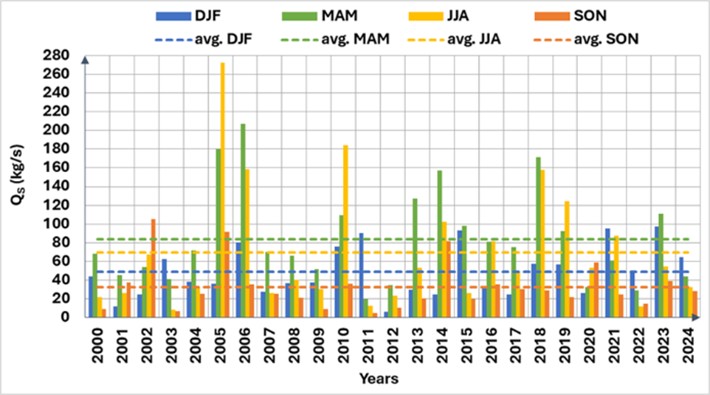
Similar to water discharge, the multi-year average of spring suspended sediment discharge (MAM) exceeds the multi-year averages calculated for other seasons. The lowest multi-year average is also observed in the autumn (SON).
However, during high-water years (e.g., 2005, 2010, 2019), the annual values in spring are exceeded by those recorded during the summer.
The results may be attributed to navigation on the Sulina branch, particularly near the mouth of the river, as this activity can lead - due to heavier vessel traffic and low water levels - to the mobilization of larger quantities of suspended sediment and increased turbidity.
3.2.2. Suspended sediment budget
Furthermore, the annual suspended sediment load in the Sulina branch was computed as ratio between the outflow/inflow on the Sulina branch. The evolution of this ratio is presented in Figure 13. Higher is the percentage, more suspended sediment discharge is transported to the Sulina channel’s mouth. In the first period (2000÷2016) the ratio is variable, but starting with 2018 year, the percentage increases for two years, up to 150%, before dropping below 60% in 2022 and rising again above 80% in 2023 and 2024.
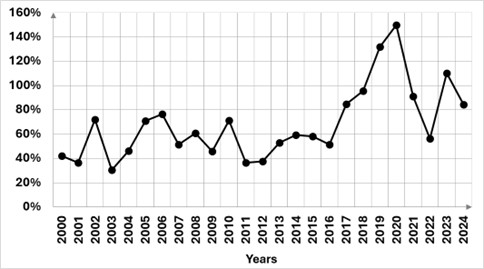
However, between 2000 and 2016, the percentages did not exceed the 80% threshold, ranging from 31% in 2003 (a year with very low water levels) to 76% in 2006 (a year with high water levels).
Our result reinforces the fact that the transport of suspended sediment at the Sulina channel’s mouth depends on several factors, such as low water level when sedimentation is favored, navigation, precipitation after low water level, connections with adjacent channels in the delta, etc.
Another analysis of sediment transport and, implicitly, the Sulina channel’s contribution to sediment input into the Black Sea, was performed based on the evolution of average annual quantities of suspended sediment.
The purpose of this analysis was to highlight the temporal and spatial variability of the solid component along the Sulina branch. The suspended sediment quantity was determined as difference (downstream minus upstream) between four hydrometric stations, as well as between the outlet and the inlet of the Sulina branch (Figure 14). Thus, following the variability of the suspended sediment component over time, it was found that, from the inflow to the outflow into the sea, high amounts of suspended sediment are deposited continuously along the Sulina branch and the adjacent channels, year after year.
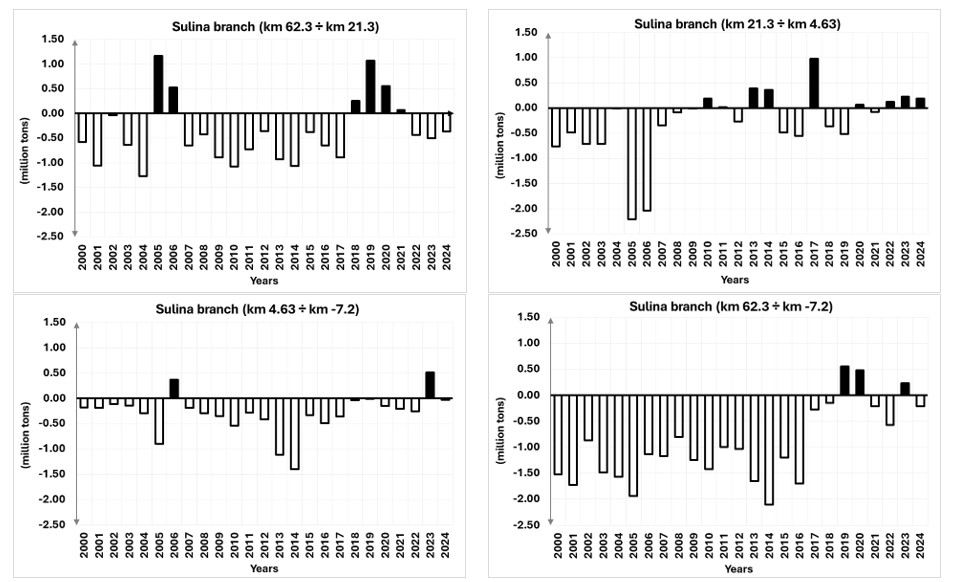
The results were highlighted by the negative balance calculated between two consecutive stations along the Sulina branch (Table 1), as well as between the exit into the Black Sea and the entrance to the branch (Sulina Semnal Ceata station minus Ceatal Sf. Gheorghe station).
The analysis of the suspended sediment balance, for the period 2000÷2024, shows that alluvial deposits of approximately 25 million tons remain along the Sulina branch and the ecosystem situated in the vicinity of the channel, in comparison with 1.3 million tons that are transported out to sea.
Furthermore, for each sector, from upstream to downstream, average sediment deposition quantities of approximately 13, 10, and 8 million tons, respectively, were determined. The largest annual quantities of suspended sediment were determined within the sector Crisan (km 21.3) – Sulina Port (km 4.63), in 2005 and 2006 (years with high water levels), while across the entire branch and the adjacent channels, two years were identified, 2005 and 2014 (year with values close to the multiannual average flows).
The lowest suspended sediment quantities deposited in the riverbed were recorded within the sector km 4.63 (Sulina Port) ÷ km -7.2 (Sulina Semnal Ceata), with values occasionally exceeding 1 million tons (in 2013 and 2014 years).
This comparative analysis of the three sectors revealed that there are years with noticeable differences between the sections, as well as an alternation of accumulation and allochthonous input of suspended sediment between the sectors. The predominance of sedimentation/erosion process occurs differently on the three sectors. In the first sector (km 62.3 – km 21.3) and the last one (km 4.63 – km -7.2), suspended sediment accumulation (negative sediment budget) is predominant for 19 years, respectively 23 years over the analyzed period (25 years).
On the middle sector (km 21.3 – km 4.63) there is an alternation of sedimentation/erosion process starting from 2010 year and only 16 years with negative sediment budget over the last 25 years. The study provides evidence of anthropogenically driven resuspension processes. The intensity of navigation and dredging activities can significantly influence sediment dynamics through resuspension, redistribution, and alteration of hydrodynamic conditions, representing potential sources of variability. Granulometric analyses are an indicator of anthropogenic impact in the delta area (Ispas et al., 2024), but they were not the focus of this study.
Like the Danube delta, other worldwide deltas are characterized by changes of morphological evolution and modification of sediment budget under the human-induced changes, like river catchments that have been variably dammed and navigation dredging activities. However, Besset et al. (2017) analyzed the vulnerability status of different deltas to wave activity of the seas, by quantifying changes in delta protrusion area, defined as the area of delta protuberance relative to a straight shoreline. Their results show that eight of the ten deltas (Nile, Rhône, Ebro, Ceyhan, Arno, Ombrone, Moulouya, Medjerda) are in erosion, whereas two (Danube delta & Po delta) show stability, suggesting that the role of dams regarding the delta shoreline erosion may have been over-estimated. Through the interpretation of satellite images and hydrological analyses, Ninfo et al. (2018) showed that, recently (after 2010 year), the Po delta shows aggradation of new mouth-bars at the main distributary mouth. The ongoing trend marks a countertendency compared to many deltas worldwide.
On the other hand, through a comparative analysis of the sediment transport dynamics of Danube Delta and several European deltas, like the Po, Ebro, Rhine-Meuse, Rhône, and Volga deltas, we founded that there are environmental differences. In the heavily engineered European deltas (Po, Ebro, Rhine-Meuse, Rhône), the river channels have become similar to artificial canals and almost the entire active sediment load arrived directly to the mouth. For example, Cox et al. (2021) have analyzed sediment budget of Rhine-Meuse Delta of the Netherlands, showing that there is a negative value (more outgoing than incoming sediment), due to the intensive dredging activities for navigation, through which the sediment is directly removes from the system.
Unlike the mentioned deltas, the Volga delta, which is not completely locked in by dykes, remains a semi-natural area, where large amount of sediment is actively trapped inside the delta’s area. Recent hydrological studies (Zavadskaya et al., 2021) have shown that the current distribution of water flow and suspended sediment load inside the Volga delta, differs from the second half of the XX century, indicating transformation of the rate of erosion and accumulative processes within the deltaic branches, allowing the delineation of erosion and accumulation of suspended matter in different phases of the water regime.
4. CONCLUSIONS
International cooperation has a particular importance given significant climatic variability and pronounced anthropogenic influence.
The obtained results offer an actual image of water flow and suspended sediment transport on the Sulina Branch and the possibility to predict the effect of climatic changes at the exit to the Black Sea.
The increase in averaged air temperature over the Danube Delta area, in summer and winter of time horizon 2021÷2050 compared with 1971÷2000 represent changes of climatic conditions that affects the hydrometeorological parameters (e.g. more days with water temperature above 27 °C) and the hydrological regimes (Trifu et al., 2022).
Variations in the water discharge of the Sulina branch into the Black Sea - on an annual, seasonal, and multi-year monthly basis - were also analyzed in this study to determine the percentage of the water flow transported through the branch that reached the sea. Thus, based on the ratio determined between the discharge values at the outlet (Sulina Semnal Ceata h.s.) and the inlet (Ceatal Sf. Gheorghe h.s.) of the branch, a coefficient (%) was derived, which is presented at both the annual and seasonal levels, as well as on a monthly multiannual basis, for various time intervals (5-year periods), in this paper.
Analysis the Sulina channel’s flow contribution into the Black Sea, the computed percentage reveals that, for the period 2000÷2024, it accounts for an average of 87%, with the remaining 13% allocated to the Danube Delta.
An analysis of the total quantities of suspended sediment transported through the Sulina branch over the past 25 years shows a significant decrease, from 70.10 million tons at the inlet (at Ceatal Sf. Gheorghe h.s.), to 60.86 million tons at Crisan h.s. (km 21.3), to 53.8 million tons at Sulina Port h.s. (km 4.63), down to 46.43 million tons at the outlet, Sulina Semnal Ceata h.s. (km -7.2). This means that approximately 66% of the total sediment volume entering the Sulina branch reached the Black Sea.
Instead, over the past 5 years, approximately the same amount of suspended sediment that entered the Sulina branch is found at the branch’s outlet. According to Pekarova et al. (2019), the statistical analyses of 85-years daily series of Danube River (Ceatal Izmail h.s.) show that the number of large floods on the Danube will not increase, their peak and their duration will increase slightly. Our analyze of the last 25 years confirm a part of this result, showing that the trend of extremes is decreasing, on the Danube River before the delta and on the main branches of the Danube Delta – Sulina branch.
The present study presents certain limitations generated by the lack of explanatory variables regarding the anthropogenic activities carried out on the Sulina branch. No data on the intensity of vessel traffic (number and type of boats), nor information on the frequency, volume and location of dredging work were analyzed. In the absence of this information, the results mainly reflect the variations highlighted by the analyzed series, without allowing the quantification of the contribution of these factors to sediment dynamics. Further research is warranted to explore their implications for the accumulation / erosion processes along the Sulina branch.
Acknowledgments
The authors acknowledge the support of the project “HORIZON-MISS-2021-OCEAN-02, Danube Region Water Lighthouse Action - DALIA” Project No. 101094070, funded by the European Union’s Horizon program. This work was supported by the National Institute of Hydrology and Water Management.
REFERENCES
- Besset, M., Anthony, E.J. & Sabatier, F., 2017. River delta shoreline reworking and erosion in the Mediterranean and Black Seas: the potential roles of fluvial sediment starvation and other factors. Elementa: Science of the Anthropocene 5:54, https://doi.org/10.1525/elementa.139.
- Bondar, C., 2010. Date privind evidenţierea schimbărilor climatice şi a impacturilor antropice produse asupra regimului hidrologic şi morfologic al Dunării, Deltei Dunării şi Mării Negre. INHGA Conferinţa Ştiinţifică Jubiliara, 28-30 septembrie 2010.
- Bondar, C. & Iordache, G., 2017. Sediment transport on the Danube River in the Romanian border area – characteristics. Rev. Roum. Geogr./Rom. Journ. Geogr., 61, (1), p.3-17, Bucuresti.
- Bondar, C. & Panin, N., 2021. The Danube Delta Hydrologic database and modelling. Geo-Eco-Marina, 5-6/2000-2021, National Institute of Marine Geology and Geo-ecology.
- Budileanu, M., 2013. Evolution of Sulina mouth bar (Danube River). Revista de Geomorfologie, vol. 15, 2013, pp. 49-55.
- Cox, J.R., Dunn, F.E., Nienhuis, J.H., van der Perk, M. & Kleinhans, M.G., 2021. Climate change and human influences on sediment fluxes and the sediment budget of an urban delta: the example of the lower Rhine–Meuse delta distributary network. Canadian Science Publishing, Anthropocene Coasts 4: 251–280, dx.doi.org/10.1139/anc-2021-0003.
- Cretu, R. C., Hontus, A. C., Smedescu, D.I. & Cretu, R.F., 2018. Analysis of the climate change phenomena from the Danube Delta, Romania - causes, effects, solutions. In Proceedings of 18th International Multidisciplinary Scientific GeoConference SGEM, vol. 18, no. 5.2, pp.49-56, ISBN: 978-619-7408-47-8, DOI: 10.5593/sgem2018/5.2/S20.007.
- Croitoru, A-E., Horvath, C. & Man, T-C., 2022. Assessment of Climate Conditions and Changes Detected Over the Historical Period (1961–2013). In: A.M. Negm and D.C. Diaconu (eds.), The Danube River Delta, Earth and Environmental Sciences Library, Springer Nature Switzerland, (pp.77-99), https://doi.org/10.1007/978-3-031-03983-6_4.
- Gastescu, P., 2009. The Danube Delta biosphere reserve. Geography, biodiversity, protection, management. Revue Roumaine de Géographie, volume 53(2), 2009.
- Gastescu, P., 2010. Water resources from Romania. Vulnerability to the pressure of man’s activities. Romanian, Limnogeographical Association Conference Proceedings, ISBN: 978-606-8042-65-7, 11-13 June 2010.
- Gastescu, P. & Tuchiu E., 2023. The Danube River and its delta, hydrogeographic characteristics – actual synthesis. pp. 1-16. In Gastescu, P., Bretcan, P. (eds.) Water resources and wetlands, 6th International Hybrid Conference Water resources and wetlands, 13-17 September 2023, Tulcea (Romania), pp. 287, available online at http://www.limnology.ro/wrw2023/proceedings.html.
- Gheorghe, P.B., Tiganus, M., Seceleanu-Odor, D., Suliman, I., Ibram, O., Matei, N., Burada, A. & Despina, C., 2025. Comparative nutrient analysis of two freshwater lakes located in the pre-deltaic and deltaic areas with natural hydrological regimes. Scientific Annals of the Danube Delta Institute 30, 107-122, https://doi.org/10.3897/saddi.30.160992.
- Ispas, B.-A., Catianis, I. & Partale, A., 2024. 2-year grain size monitoring of the riverbed sediments from Danube Delta. Carpathian Journal of Earth and Environmental Sciences February 2024, Vol. 19, No. 1, p. 73 – 88, DOI:10.26471/cjees/2024/019/291.
- Ninfo, A., Ciavola, P. & Billi, P., 2018. The Po Delta is restarting progradation: geomorphological evolution based on a 47-years Earth Observation dataset. Scientific Reports, 8, 3457, DOI:10.1038/s41598-018-21928-3.
- Panin, N., 1999. Danube Delta: Geology, Sedimentology, Evolution. Association des Sédimentologistes Français, Maison de la Géologie, Paris, 66 p.
- Pekarova, P., Gorbachova, L., Mitkova, V. B., Pekar, J. & Miklanek, P., 2019. Statistical Analysis of Hydrological Regime of the Danube River at Ceatal Izmail Station. IOP Conf. Series: Earth and Environmental Science 221 012035, doi:10.1088/1755-1315/221/1/012035.
- Pojar, I., Tiron, Dutu, L., Pop, C. I. & Dutu, F., 2021. Hydrodynamic observations on microplastic abundances and morphologies in the Danube Delta, Romania. AgroLife Scientific Journal - Volume 10, Number 2, 2021, ISSN 2285-5718; ISSN CD-ROM 2285-5726; ISSN ONLINE 2286-0126; ISSN-L 2285-5718.
- Stancu, M.V., Cheveresan, M., I., Sarbu, D., Maizel, A., Soare, R., Barbulescu, A. & Dumitriu, C.S., 2024. Influence of Marine Currents, Waves, and Shipping Traffic on Sulina Channel Fairway at the Mouth of the Black Sea. Water, 16, 2779, https://doi.org/10.3390/w16192779.
- Trifu, M. C., Borcia, C., Luca, E. & Bojariu, R., 2022. Water Flow Variability in the Danube Delta Under Climatic Changes Conditions. In: A.M. Negm and D.C. Diaconu (eds.), The Danube River Delta, Earth and Environmental Sciences Library, Springer Nature Switzerland, pp. 101-125, https://doi.org/10.1007/978-3-031-03983-6_4.
- United Nations Economic Commission for Europe (UNECE), 2007. Drainage basin of the Black Sea (Chapter 5). In Our Waters: Joining Hands Across Borders: First Assessment of Transboundary Rivers, Lakes and Groundwaters, pp. 95–144. United Nations, https://unece.org/fileadmin/DAM/ env/water/blanks/assessment/assessmentweb_full.pdf.
- Zavadskaya, M., Zavadskiy, A., & Lychagin, M., 2021. Present distribution and variability of water flow, suspended sediment load, and geochemical runoff in the Volga River delta. EGU General Assembly 2021, online, 19–30 Apr 2021, EGU21-9698, https://doi.org/10.5194/egusphere-egu21-9698
- Zavoianu, I., 2002. Hydrologie. Ed. Fundatia Romania de Maine, Bucuresti, 283 p., ISBN: 973-582-456-6.