
1. INTRODUCTION
Groundwater serves as a critical water resource, particularly in regions where surface water is limited. This is especially important for the northeastern Thailand, where rapid population growth, urbanization, industrialization, and agricultural expansion are placing increasing pressure on water resources (Srisuk & Nettasana, 2017; Pholkern et al., 2018; Eamrat et al., 2022). Khon Kaen Province is located in this region and faces particularly high groundwater demand further complicated by widespread salinity problems in both groundwater and agricultural soils (Ramnarong & Buapeng, 1985; Patcharapreecha et al., 1989; Dissataporn et al., 2002; Nettasana et al., 2012; Srisuk & Nettasana, 2017; Arjwech et al., 2019; Yoshida et al., 2021). Understanding groundwater salinity and the geochemical processes that influence it is essential for effective water resource management. Groundwater salinization results from various natural and anthropogenic processes, with salinity defined by the concentration of dissolved solids containing ions such as sodium, chloride, magnesium, calcium, and sulfate (Li et al., 2020). These dissolved ions originate from multiple sources, including mineral dissolution, weathering reactions, ion exchange, and human activities, creating distinct salinity patterns across different regions (Lorenzen et al., 2012; Li et al., 2020; Said et al., 2022).
Groundwater salinization in Khon Kaen Province, is primarily associated with the Maha Sarakham Formation, which consists of evaporite deposits including halite, gypsum, and anhydrite (Sattayarak, 1983; Utha-Aroon, 1993; El Tabakh et al., 1999; Satarugsa et al., 2005). Dissolution of these minerals along groundwater flow paths results in high salinity in discharge areas (Richter & Kreitler, 1993; Merchán et al., 2015; Jia et al., 2017). This natural salinization is intensified by anthropogenic activities, including intensive irrigation, deforestation, groundwater over-extraction, and local salt production (Wongsomsak, 1986; Saraphirom et al., 2013; Arunin & Pongwichian, 2015; Arjwech et al., 2019). Ongsomwang et al. (2019) analyzed land use change in the region and projected substantial increases in anthropogenic pressures. Their analysis indicates that urban and built-up areas will expand from 57 km2 in 2006 to 399 km2 by 2026, while agricultural lands will decline correspondingly. These land use transitions modify groundwater recharge patterns, alter surface-groundwater interactions, and introduce new contamination pathways that compound natural salinization processes. However, the relative influence of natural versus anthropogenic factors varies across seasons due to variations in precipitation, evapotranspiration, and agricultural activities driven by the tropical monsoon climate.
Despite extensive research on groundwater salinity in northeastern Thailand, critical knowledge gaps persist regarding the temporal dynamics of salinization processes. Previous studies have predominantly relied on single-season sampling (Dissataporn et al., 2002; Saraphirom et al., 2013; Pholkern et al., 2018), which cannot capture temporal variations in hydrogeochemical processes, where monthly rainfall varies from less than 100 mm during the dry season to over 200 mm during the wet season. The relative contributions of evaporite dissolution, silicate weathering, ion exchange, and anthropogenic contamination have not been systematically investigated across seasons. Additionally, multivariate statistical methods, such as Hierarchical Cluster Analysis (HCA) and Principal Component Analysis (PCA), have proven highly effective for identifying principal factors controlling groundwater composition (Walter et al., 2017; Ferchichi et al., 2018; Panagiotou et al., 2022; Zhang et al., 2022; Al Maliki et al., 2024); their integrated application to multi-seasonal datasets represents a significant opportunity to advance understanding of temporal hydrogeochemical processes.
This study addresses these gaps by integrating traditional hydrogeochemical analysis with multivariate statistical methods across three seasons: January, May, and September (dry, transition, and wet seasons, respectively). Groundwater samples were collected from Dang Yai Subdistrict in Khon Kaen Province, which was strategically selected due to its geological diversity, including the salt-rich Maha Sarakham Formation overlain by unconsolidated alluvial deposits, and its location along a hydrogeological gradient from recharge to discharge areas. While the area increasingly faces risks of saline water intrusion into freshwater zones, significant volumes of high-quality groundwater remain, especially within shallow alluvial aquifers that serve as vital water sources (Udomsilpa, 2004; DGR, 2017). The objectives are to characterize the temporal evolution of hydrogeochemical facies across seasons and to quantify seasonal variations in processes controlling groundwater salinization through integrated multivariate statistical and hydrogeochemical analyses. The findings will provide critical insights for sustainable groundwater management in evaporite-influenced aquifer systems under increasing anthropogenic and climate pressures.
2. MATERIALS AND METHODS
2.1. Study Area
This study focuses on the Dang Yai Subdistrict, covering an area of approximately 40 km2, in Mueang Khon Kaen District, Khon Kaen Province, in northeastern Thailand (Figure 1). According to land use data from the Land Development Department (2022), agricultural activities dominate the subdistrict (around 93%), with Paddy fields (54.18%), field crops including sugarcane and cassava (31%), urban areas (12.04%), and surface water bodies (6.35%). The area has experienced growing water demand driven by urban expansion (Van Ninh & Waisurasingha, 2018) and small-scale but water-intensive industries, such as ice and drinking water production, which rely primarily on groundwater resources. Intensive agricultural practices, combined with urban expansion and the presence of soil pits and abandoned land, create multiple potential pathways for groundwater contamination through agricultural runoff and domestic wastewater discharge.
Surface elevation within the study area ranges from approximately 160 to 220 m above mean sea level, with surface topography characterized by highland areas in the northeastern and northwestern parts. The terrain gradually slopes southward and southeastward toward lower elevation zones, controlling groundwater flow from elevated recharge areas toward discharge zones in the southern and southeastern portions. The average annual rainfall in Mueang Khon Kaen District is approximately 1,557.7 mm (1978-2023), with the majority occurring during the wet season (May to October). The dry season receives less than 100 mm per month. This seasonal rainfall distribution leads to limited surface water availability and increased reliance on groundwater, particularly during the dry months.
Regional groundwater follows a flow pattern from higher elevations in the north and northwest toward the southeast (Lertsirivorakul et al., 1984; Udomsilpa, 2004). Surface water bodies are primarily concentrated in the elevated northern portion, where natural streams and soil pits serve as potential recharge zones. In contrast, groundwater discharge occurs predominantly in the southern lowlands, as evidenced by salt crust on the land surface. This phenomenon results from evaporite dissolution and subsequent salt precipitation in shallow aquifers (Salama et al., 1999; Wen et al., 2005; Li et al., 2020). This topographically controlled flow system establishes distinct hydrogeochemical zones, from freshwater recharge areas in the elevated north to saline discharge areas in the southern lowlands
The geologic setting of the study area is situated within the Khon Kaen Basin, located along the western margin of the Khorat Plateau. The near-surface deposits primarily consist of unconsolidated Quaternary alluvial and terrace sediments, composed of loess, fine-grained sediments, and gravel, with thicknesses ranging from less than 1 m to over 5 m (Nettasana et al., 2012). These unconsolidated materials form shallow unconfined to semi-confined aquifers. The water table typically lies at 1 to 10 m below ground level, depending on seasonal conditions. The water-bearing layers vary in thickness from 5 to 70 m and serve as the principal water source for domestic use and agricultural activities. In these unconsolidated aquifers, groundwater tends to have relatively lower salinity (Lertsirivorakul et al., 1984). Groundwater is recharged primarily through direct infiltration of precipitation during the wet season and surface water infiltration.

Beneath these surficial deposits lies the Phu Thok Formation, which comprises reddish-brown sandstone and reddish-purple calcareous sandstone interbedded with siltstone and mudstone (Sattayarak, 1983; Arjwech et al., 2019). This unit functions as a fractured rock aquifer, where groundwater is stored within fracture zones (Lertsirivorakul et al., 1995). Underlying the Phu Thok Formation is the Maha Sarakham Formation, composed of anhydrite, claystone, potash, and interbedded rock salt, with thickness ranging from 10 to more than 200 m, depending on local geological structures influenced by rock salt deposition. Tectonic activity and sediment loading during the Tertiary period have produced synclinal and anticlinal structures that facilitate upward migration of rock salt. These features are expressed at the surface as white, circular patches associated with salt domes or anticlinal ridges, indicating saline soil conditions (Arjwech et al., 2019). Beneath the Maha Sarakham Formation lies the Khok Kruat Formation, comprising brown and reddish-brown claystone, siltstone, and sandstone, with lime-noduled conglomerate and calcrete horizons (DMR, 2009). Thin, discontinuous gypsum layers are locally present in the upper part, marking the transition to the evaporitic deposits of the overlying Maha Sarakham Formation (Racey et al., 1996). The Khok Kruat Formation is underlain by the Phu Phan Formation, which consists of grayish-white conglomeratic sandstone, gray to dark gray claystone and siltstone, along with older Mesozoic rocks of the Khorat Group (DMR, 2009).
2.2. Sampling and Analytical Methods
Groundwater samples were collected from 22 domestic wells in January and 21 wells in May and September (Figure 1), as one well (DY23) could not be resampled after we were unable to contact the homeowner for access. Sampling campaigns corresponded to three seasons: January (dry season), May (transition period), and September 2023 (wet season). Sampling locations were limited by well availability, as most residential areas are served by surface water supply systems, leading residents to rely primarily on municipal water for domestic consumption. Additionally, due to groundwater salinity problems, local farmers have avoided drilling new groundwater wells and have abandoned or backfilled existing wells, making it challenging to locate accessible groundwater sources. Consequently, sampling was based on well availability rather than systematic spatial distribution. All sampling wells had depths of less than 40 m, accessing the shallow unconfined to semi-confined aquifers. Sample collection followed standardized protocols to ensure data quality. Coordinates and surface elevations were recorded using RTK GNSS modules. Field measurements included depth to water table, pH, electrical conductivity (EC), and temperature using calibrated portable instruments. Prior to sample collection, wells were purged to ensure representative samples. Groundwater samples were stored in high-density polyethylene containers under both acidified and non-acidified conditions, and transported to the laboratory under refrigerated conditions.
Chemical analyses were conducted at the Geochemical Laboratory, Department of Geotechnology, Faculty of Technology, Khon Kaen University, following the Standard Methods for the Examination of Water and Wastewater (Baird et al., 2017). Major anions were analyzed: chloride (Cl-) by silver nitrate titration, carbonate (CO32-) and bicarbonate (HCO3-) by titration, nitrate (NO3-) by the cadmium reduction method, and sulfate (SO42-) by the turbidimetric method. Major cations, including calcium (Ca2+), magnesium (Mg2+), potassium (K+), and sodium (Na+), were quantified by flame atomic absorption spectrometry using a PerkinElmer PinAAcleTM 900F instrument equipped with hollow-cathode lamps and operated via SyngistixTM for AA software. Measurement settings and calibration parameters are summarized in Table 1. Calibration for each ion employed five standard concentrations and yielded correlation coefficients (r2) ≥ 0.99, samples with concentrations above the highest calibration standard were diluted appropriately to fall within the calibration range prior to measurement. Ion balance errors for all samples were within ±5%, which is considered acceptable for hydrogeochemical analyses.
Table 1. Instrument settings and calibration parameters for flame atomic absorption spectrometry
|
Ion |
Wavelength (nm) |
Calibration standards (mg/L) |
|
Ca2+ |
422.67 |
0.25, 0.50, 1.00, 2.50, 5.00 |
|
K+ |
769.90 |
0.10, 0.25, 0.50, 1.00, 2.00 |
|
Mg2+ |
202.58 |
0.25, 0.50, 1.00, 2.50, 5.00 |
|
Na+ |
589.00 |
0.10, 0.25, 0.50, 0.75, 1.00 |
2.3. Data Analysis Methods
A comprehensive multi-analytical approach was applied to investigate the hydrogeochemical processes controlling groundwater salinization. This approach adopted a systematic framework where traditional graphical methods were first applied to provide initial characterization, followed by multivariate statistical techniques implemented in RStudio, version 4.4.1 (Posit Team, 2025), for detailed grouping and interpretation.
Traditional hydrogeochemical diagrams were used to characterize groundwater chemistry and identify preliminary hydrogeochemical patterns. The Piper diagram (Piper, 1944) was used to classify groundwater types based on major ion compositions and identify dominant hydrogeochemical facies. The Durov diagram (Durov, 1948) was used to refine hydrogeochemical classification and infer evolutionary trends. These diagrams provided insights into relative proportions of major ions and established a hydrogeochemical framework for subsequent analysis.
Hierarchical Cluster Analysis (HCA) was applied as the primary multivariate tool to group groundwater samples with similar chemical characteristics, identifying distinct hydrogeochemical relationships and delineating specific water types for each sampling period (Güler et al., 2002; Walter et al., 2017; Rahbar et al., 2020). HCA was performed using Ward's method with Euclidean distance as the similarity measure, and all chemical parameters were standardized to prevent bias from variables with different units and ranges.
Principal Component Analysis (PCA) was applied to reduce the dimensionality of the groundwater chemistry dataset and identify main sources of variation within each hydrogeochemical group. The PCA results were used to identify key influencing factors such as water-rock interactions, saline water intrusion, and anthropogenic inputs for each cluster (Jiang et al., 2015; Walter et al., 2017). For each hydrogeochemical group, relationships between dissolved ions were used to identify geochemical processes operating within the aquifers (Fisher & Mulican, 1997; Subba Rao, 2008; Aghazadeh & Mogaddam, 2011). Group-specific interpretation was conducted using the Gibbs diagram (Gibbs, 1970), Gaillardet diagram (Gaillardet et al., 1999), and ion-ion binary plots to understand dominant hydrogeochemical processes within each cluster.
The Gibbs diagram plots Na+/(Na++Ca2+) for cations and Cl-/(Cl-+HCO3-) for anions against total dissolved solids (TDS), enabling identification of three primary hydrogeochemical mechanisms: atmospheric precipitation, water-rock interaction, and evaporation. Each hydrogeochemical group was evaluated separately to determine the dominant geochemical regime. To further investigate water-rock interactions within each group, the Gaillardet diagram, which uses the ratios of Ca2+/Na+, Mg2+/Na+, and HCO3-/Na+, was employed to determine the relative contributions of carbonate dissolution, silicate weathering, and evaporite dissolution to groundwater chemistry. Additionally, binary plots, such as Na++K+ versus Cl- and Na++K+ versus total cations, were utilized to support the interpretation of geochemical reactions. This systematic approach of clustering followed by group-specific analysis provides a comprehensive understanding of the geochemical processes occurring within different zones of the aquifer system and their temporal changes across the three sampling periods.
3. RESULTS AND DISCUSSION
3.1. Hydrogeological and hydrogeochemical characteristics
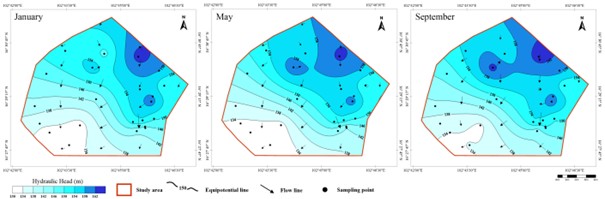
Hydraulic heads show distinct seasonal variations: 132.23 - 163.90 m in January, 131.34 -163.11 m in May, and 133.05 to 163.91 m in September. May represents the lowest values due to prolonged dry season depletion, while September shows recovery from monsoon recharge. Groundwater flows from the northeast (recharge zone) toward the southwest (Figure 2). The highest hydraulic heads occur in the central and northeastern parts, while lower heads in the western and southwestern zones reflect intensive groundwater abstraction. This seasonal pattern reflects the tropical monsoon climate, with minimum levels in May and substantial recovery in September.
Statistical summaries of all physicochemical parameters are presented in Table 2. EC ranges from 107.6 to 14,660.0 µS/cm in January, decreasing through May (208.1-14,150.0 µS/cm) to September (153.0-13,180.0 µS/cm), with mean values declining by 12.6% from the dry to wet season. Sodium shows the highest cation concentrations (mean: 309.37-380.35 mg/L), while chloride dominates (mean: 444.68-487.16 mg/L). Sodium decreased by 18.7% from January to September, while chloride showed only a 6.8% reduction, suggesting differential mobility. Strong positive correlations (Table 3) between EC, TDS, sodium, and chloride (r = 0.91 - 0.99 across all three seasons) indicate salinization primarily controlled by halite dissolution associated with the Maha Sarakham Formation.
Calcium and sulfate demonstrate strong correlations across all periods (r = 0.96, 0.92, and 0.93 in January, May, and September, respectively). The highest Ca2+ concentration (783.00 mg/L) occurs in May, indicating enhanced gypsum dissolution during early monsoon recharge when aggressive groundwater interacts with sulfate minerals. Mean calcium increased by 12.1% from January to September, contrasting with sodium-chloride dilution and suggesting enhanced mineral dissolution during recharge.
HCO3- concentrations peak at 1,170 mg/L in January and decline to 627.14 mg/L in September, reflecting seasonal variation in water-rock interaction intensity. HCO3- correlations with Mg2+ strengthen from the dry season (r = 0.35 in January) to early wet season (r = 0.75 in May), before decreasing to r = 0.51 in September. A similar pattern emerges for Ca2+ that correlations with HCO3- rise from r = 0.19 in January to r = 0.77 in May, then falls back to r = 0.31 in September. This trend closely tracks the Mg2+ pattern and points to intensified carbonate mineral dissolution at the onset of monsoon recharge. Consistent with this interpretation, Ca2+ and Mg2+ themselves remain strongly correlated throughout the year (r = 0.72, 0.71, and 0.83 in January, May, and September, respectively), reinforcing dolomite dissolution as a shared source for both cations, with their association becoming most pronounced by September.
Mg2+ also develops a stronger correlation with SO42- by the end of the wet season (r = 0.61, 0.57, and 0.72 in January, May, and September, respectively), suggesting that dolomite and gypsum dissolution become increasingly coupled processes as the aquifer transitions from monsoon recharge to recovery. Interestingly, HCO3- also shows its strongest association with Na+ in January (r = 0.79), weakening substantially by May (r = 0.37) before partially recovering by September (r = 0.59), indicating that the coupling between bicarbonate and sodium is not consistently tied to the wet-dry cycle and may instead reflect localized silicate weathering or ion-exchange processes active at different times of year.
NO3- concentrations reach a peak of 50.34 mg/L in January, with eleven sampling locations consistently exhibiting elevated concentrations across all three seasons, indicating a persistent agricultural contamination source. NO3- and K+ correlations follow a clear downward trajectory across the year, from r = 0.87 in January to r = 0.64 in May, and down to r = 0.22 in September, indicating progressive seasonal dilution of agricultural contaminants while an underlying anthropogenic source persists. Across all three sampling periods, no strongly negative correlations were observed among any parameter pairs.
3.2. Hydrogeochemical facies and temporal evolution
The Piper trilinear diagram (Figure 3) reveals that Sodium-Chloride facies dominates throughout all sampling periods (36-38% of samples), followed by Calcium-Bicarbonate facies (23-33%). This distribution reflects progressive sodium and chloride enrichment along the flow path from recharge to discharge areas, influenced by the salt-rich Maha Sarakham Formation. Calcium-Bicarbonate facies predominate in recharge areas overlying Quaternary terrace deposits and the Khok Kruat Formation, while Sodium-Chloride facies concentrate in discharge zones where anticlinal structures bring evaporite minerals closer to the surface.
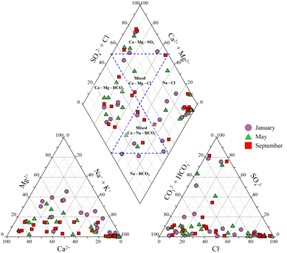
Table 2. Statistical information of physicochemical parameters in groundwater samples.
Table 3. Correlation matrix of physicochemical parameters in groundwater samples.
|
Month |
Parameter |
pH |
EC |
TDS |
HCO3- |
CO32- |
Cl- |
NO3- |
SO42- |
Ca2+ |
K+ |
Mg2+ |
Na+ |
|
January (dry season) |
pH |
1.00 |
|
|
|
|
|
|
|
|
|
|
|
|
EC |
0.17 |
1.00 |
|
|
|
|
|
|
|
|
|
|
|
|
TDS |
0.10 |
0.99 |
1.00 |
|
|
|
|
|
|
|
|
|
|
|
HCO3- |
0.19 |
0.87 |
0.85 |
1.00 |
|
|
|
|
|
|
|
|
|
|
CO32- |
0.42 |
0.19 |
0.13 |
0.32 |
1.00 |
|
|
|
|
|
|
|
|
|
Cl- |
0.18 |
0.95 |
0.92 |
0.75 |
-0.01 |
1.00 |
|
|
|
|
|
|
|
|
NO3- |
-0.09 |
0.00 |
-0.03 |
0.12 |
-0.12 |
0.00 |
1.00 |
|
|
|
|
|
|
|
SO42- |
-0.28 |
0.09 |
0.22 |
0.08 |
-0.08 |
-0.09 |
-0.11 |
1.00 |
|
|
|
|
|
|
Ca2+ |
-0.27 |
0.20 |
0.33 |
0.19 |
-0.11 |
0.03 |
-0.09 |
0.96 |
1.00 |
|
|
|
|
|
K+ |
-0.09 |
0.04 |
0.02 |
0.21 |
-0.03 |
0.00 |
0.87 |
-0.01 |
0.02 |
1.00 |
|
|
|
|
Mg2+ |
-0.31 |
0.11 |
0.21 |
0.35 |
-0.19 |
-0.01 |
-0.03 |
0.61 |
0.72 |
0.12 |
1.00 |
|
|
|
Na+ |
0.20 |
0.97 |
0.94 |
0.79 |
0.05 |
0.99 |
0.00 |
-0.06 |
0.04 |
0.01 |
-0.02 |
1.00 |
|
|
May (transition period)
|
pH |
1.00 |
|
|
|
|
|
|
|
|
|
|
|
|
EC |
0.13 |
1.00 |
|
|
|
|
|
|
|
|
|
|
|
|
TDS |
0.09 |
0.99 |
1.00 |
|
|
|
|
|
|
|
|
|
|
|
HCO3- |
-0.14 |
0.50 |
0.57 |
1.00 |
|
|
|
|
|
|
|
|
|
|
CO32- |
0.24 |
0.77 |
0.74 |
0.46 |
1.00 |
|
|
|
|
|
|
|
|
|
Cl- |
0.25 |
0.96 |
0.93 |
0.34 |
0.77 |
1.00 |
|
|
|
|
|
|
|
|
NO3- |
-0.14 |
-0.11 |
-0.12 |
-0.18 |
0.01 |
-0.13 |
1.00 |
|
|
|
|
|
|
|
SO42- |
-0.27 |
0.11 |
0.23 |
0.59 |
-0.17 |
-0.10 |
-0.14 |
1.00 |
|
|
|
|
|
|
Ca2+ |
-0.30 |
0.14 |
0.25 |
0.77 |
-0.09 |
-0.07 |
-0.14 |
0.92 |
1.00 |
|
|
|
|
|
K+ |
-0.17 |
0.00 |
0.01 |
0.23 |
0.20 |
-0.07 |
0.64 |
0.08 |
0.11 |
1.00 |
|
|
|
|
Mg2+ |
-0.40 |
-0.04 |
0.03 |
0.75 |
0.13 |
-0.21 |
-0.11 |
0.57 |
0.71 |
0.31 |
1.00 |
|
|
|
Na+ |
0.22 |
0.97 |
0.95 |
0.37 |
0.79 |
0.99 |
-0.14 |
-0.04 |
-0.03 |
-0.05 |
-0.18 |
1.00 |
|
|
September (wet season) |
pH |
1.00 |
|
|
|
|
|
|
|
|
|
|
|
|
EC |
0.30 |
1.00 |
|
|
|
|
|
|
|
|
|
|
|
|
TDS |
0.27 |
0.99 |
1.00 |
|
|
|
|
|
|
|
|
|
|
|
HCO3- |
0.27 |
0.63 |
0.62 |
1.00 |
|
|
|
|
|
|
|
|
|
|
CO32- |
0.43 |
0.61 |
0.56 |
0.69 |
1.00 |
|
|
|
|
|
|
|
|
|
Cl- |
0.31 |
0.96 |
0.91 |
0.54 |
0.60 |
1.00 |
|
|
|
|
|
|
|
|
NO3- |
-0.10 |
-0.02 |
-0.03 |
0.33 |
0.52 |
-0.02 |
1.00 |
|
|
|
|
|
|
|
SO42- |
-0.05 |
0.16 |
0.29 |
0.08 |
-0.19 |
-0.10 |
-0.13 |
1.00 |
|
|
|
|
|
|
Ca2+ |
-0.08 |
0.26 |
0.38 |
0.31 |
-0.05 |
0.02 |
-0.02 |
0.93 |
1.00 |
|
|
|
|
|
K+ |
0.01 |
0.06 |
0.07 |
0.16 |
0.25 |
0.01 |
0.22 |
0.04 |
0.06 |
1.00 |
|
|
|
|
Mg2+ |
-0.17 |
0.17 |
0.27 |
0.51 |
-0.04 |
-0.07 |
0.00 |
0.72 |
0.83 |
0.03 |
1.00 |
|
|
|
Na+ |
0.34 |
0.97 |
0.93 |
0.59 |
0.65 |
0.99 |
0.01 |
-0.06 |
0.05 |
0.01 |
-0.02 |
1.00 |
Temporal analysis shows distinct seasonal variations driven by monsoon recharge patterns. Calcium-Bicarbonate facies exhibit the greatest seasonal variation, increasing from 23% in January to 33% in May, then decreasing to 27% in September. This pattern reflects enhanced carbonate weathering during the wet season transition when low-ionic-strength recharge intensifies water-rock interactions, followed by dilution during peak monsoon. Calcium-Sulfate facies remains relatively stable at approximately 14% in each period, indicating persistent gypsum dissolution from the Khok Kruat Formation. Mixed facies show varying patterns, with Sodium-Bicarbonate facies appearing exclusively in January, suggesting specific low-recharge conditions promoting this transitional water type through cation exchange processes during extended residence times.
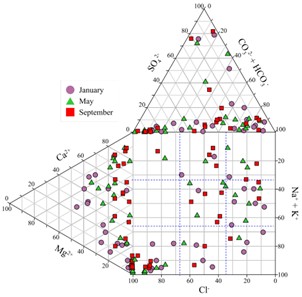
The Durov diagram (Figure 4) provides additional insights into geochemical processes. Following Lloyd and Heathcote (1985) classification, most samples fall in calcium-bicarbonate dominant fields with a noticeable trend toward sodium dominance, suggesting cation exchange processes. Furthermore, numerous samples are located in the sodium-chloride dominant field, indicating evaporite dissolution or deep saline water intrusion influence. The positioning of samples in transitional zones between these fields reflects the complex interplay of multiple hydrogeochemical processes operating simultaneously across the aquifer system.
3.3. Hierarchical cluster analysis (HCA)
Hierarchical Cluster Analysis (HCA) grouped samples into distinct hydrogeochemical clusters by chemical similarity rather than by well location, so the clustering itself is not directly biased by the uneven well distribution resulting from availability constraints. The results of HCA, presented as dendrograms for three sampling periods (Figure 5), show comprehensive insight into the temporal variations of geochemical relationships among groundwater samples. In dendrograms, shorter linkage distances indicate higher chemical similarity, while longer distances show greater differences (Selmane et al., 2022). Four main clusters were identified in all sampling periods, with internal subgroup differences (Table 4). A total of 13 out of 22 samples remained within the same main cluster across all seasons, while 9 samples moved between clusters or subgroups, demonstrating dynamic responses to seasonal hydrogeological changes.
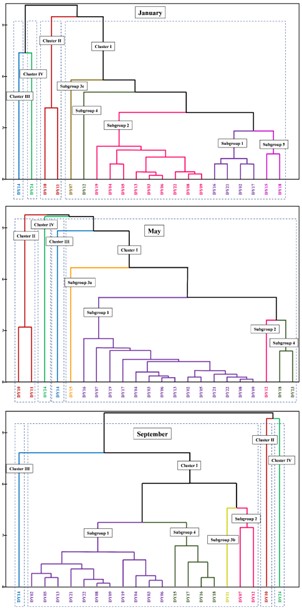
Cluster I encompassed the majority of samples, representing fresh to moderately mineralized groundwater with significant seasonal variations. Subgroup 1 declined from 14 samples (January) to 4 (September) as monsoon dilution caused migration to subgroup 2. Core members showed moderate increases in Na+ (94.7 to 160.9 mg/L) and Cl- (112.9 to 189.1 mg/L), though high variability (Cl- SD = 220.4 mg/L in September) reflects heterogeneous mixing along flow paths. Subgroup 2 evolved from a single sample (DY12) in January to 9 samples in September, with HCO3- decreasing from 620 mg/L to 90.3±73.4 mg/L, demonstrating widespread monsoon dilution.
Subgroup 3 represented distinct hydrochemical end-members: 3a (January) showed high HCO3- and Na+; 3b (May) exhibited SO42- dominance (1,073.6 mg/L) from gypsum dissolution; 3c (September) displayed elevated K+ (17.5 mg/L), moderate SO42- (47.5 mg/L), and relatively low Cl- (50.1 mg/L), possibly reflecting agricultural contamination combined with local mineral dissolution. Subgroup 4 maintained moderate mineralization with complex membership changes, while subgroup 5 emerged exclusively in September (DY15, DY18) with extreme Cl- (1,235.3±358.6 mg/L), demonstrating localized salinization despite regional dilution trends.
Cluster II displayed distinctive sulfate-rich characteristics (SO42-: 1,301-1,515 mg/L; Ca2+: 508-783 mg/L), indicative of dominant gypsum dissolution processes in areas directly overlying the thin gypsum-bearing horizons of the Khok Kruat Formation. Sample DY11 showed notable mobility, transitioning from Cluster II in January to Cluster I subgroup 3b in May and back to Cluster II in September, indicating transient mixing between sulfate-rich water and dilute recharge during maximum gypsum dissolution intensity.
Cluster III exhibited moderate mineralization with persistent nitrate contamination (NO3-: 47.4-50.3 mg/L) across all seasons. The single sample (DY14) demonstrates spatially consistent agricultural contamination in areas with intensive farming and domestic animal rearing, where chemical fertilizers and manure application continuously introduce nitrogen and potassium to shallow groundwater. The temporal stability of this cluster indicates that anthropogenic contamination persists throughout the year despite seasonal dilution effects, with only a slight reduction in NO3- (50.3 to 47.4 mg/L) despite monsoon rainfall.
Cluster IV represented extreme salinization conditions (Cl-: 4,281.8-4,923.5 mg/L; Na+: 2,748.5-3,582.0 mg/L), indicative of evaporite dissolution or deep saline sources. Sample DY24 maintained extreme salinity conditions with minimal seasonal variations (Cl- decreased by only 13% from 4,923 mg/L in January to 4,282 mg/L in September), demonstrating that in areas directly overlying anticlinal structures of the Maha Sarakham Formation where rock salt occurs at shallow depths (Arjwech et al., 2019), halite dissolution creates persistent hypersaline conditions that are largely independent of seasonal recharge variations.
3.4. Principal component analysis (PCA)
Principal Component Analysis (PCA) was employed to complement HCA by identifying the main factors controlling groundwater chemistry across seasons. PCA was performed on 9 major ion concentrations from all sampling points in each period. According to the Kaiser criterion (eigenvalues >1), the first three principal components, retained together, explained approximately 80% of total variance (Table 5).
Table 4. Average concentrations (mg/L) and sample count (n) of major ions by HCA cluster and sampling period.
|
Month |
Cluster-Subgroup |
n |
HCO3- + CO32- |
Cl- |
NO3- |
SO42- |
Ca2+ |
K+ |
Mg2+ |
Na+ |
|
Jan |
I-1 |
14 |
132.3±76.9 |
112.9±176.7 |
2.9±4.5 |
17.8±21.2 |
18.5±10.1 |
5.4±7.8 |
8.7±4.1 |
94.7±129.0 |
|
|
I-2 |
1 |
620.0 |
15.0 |
0 |
45.6 |
61.2 |
6.02 |
68.64 |
80.89 |
|
|
I-3a |
1 |
794.0 |
385.5 |
0 |
64.5 |
26.6 |
10.7 |
3.10 |
575.5 |
|
|
I-4 |
2 |
376.0±56.6 |
1,474.5±141.4 |
0.7±1.0 |
34.6±10.7 |
126.5±124.4 |
10.1±1.6 |
20.7±20.3 |
1,018.3±59.0 |
|
|
II |
2 |
325.0±92.6 |
138.8±60.9 |
0 |
1,514.7±65.1 |
555.9±70.4 |
7.6±0.7 |
53.83±20.1 |
220.3±93.2 |
|
|
III |
1 |
496.0 |
366.0 |
50.3 |
78.4 |
72.6 |
96.4 |
23.9 |
325.8 |
|
|
IV |
1 |
1,170.0 |
4,923.5 |
3.60 |
41.4 |
77.6 |
6.2 |
16.4 |
3,582.0 |
|
May |
I-1 |
11 |
89.9±67.9 |
118.5±296.7 |
5.6±4.8 |
11.2±12.8 |
32.9±16.9 |
1.3±1.2 |
5.0±2.4 |
69.8±164.8 |
|
|
I-2 |
2 |
381.4±152.4 |
38.0±23.4 |
0 |
40.5±8.3 |
86.5±26.0 |
12.9±3.2 |
25.6±17.5 |
53.6±6.4 |
|
|
I-3b |
1 |
164.2 |
203.2 |
0 |
1,073.6 |
281.0 |
4.9 |
10.8 |
445.4 |
|
|
I-4 |
4 |
183.6±61.1 |
951.5±726.3 |
0 |
23.2±27.6 |
18.0±4.1 |
2.2±0.9 |
1.5±1.1 |
672.0±496.9 |
|
|
II |
1 |
904.9 |
23.0 |
0 |
1,317.3 |
783.0 |
5.03 |
37.7 |
72.1 |
|
|
III |
1 |
203.2 |
249.2 |
47.6 |
64.9 |
51.4 |
26.7 |
7.7 |
205.4 |
|
|
IV |
1 |
641.6 |
4,569.8 |
0 |
37.4 |
86.3 |
2.8 |
5.1 |
3,475.0 |
|
Sep |
I-1 |
4 |
161.4±77.6 |
189.1±220.4 |
1.1±2.1 |
7.4±3.1 |
20.0±8.0 |
1.6±0.3 |
2.0±1.5 |
160.9±140.3 |
|
|
I-2 |
9 |
90.3±73.4 |
142.5±325.0 |
4.8±3.7 |
11.8±12.2 |
39.5±23.4 |
0.9±0.7 |
3.5±1.2 |
77.8±173.1 |
|
|
I-3c |
1 |
157.1 |
50.1 |
0 |
47.5 |
48.9 |
17.5 |
4.5 |
29.9 |
|
|
I-4 |
1 |
542.9 |
24.8 |
0 |
51.8 |
108.9 |
1.1 |
21.1 |
105.9 |
|
|
I-5 |
2 |
270.7±61.6 |
1,235.3±358.6 |
0 |
25.7±28.0 |
57.4±6.2 |
3.0±2.7 |
1.8±0.2 |
804.3±159.1 |
|
|
II |
2 |
202.7±208.3 |
135.4±136.0 |
0 |
1,301.3±248.1 |
508.0±309.7 |
2.7±0.0 |
18.8±11.1 |
197.5±165.3 |
|
|
III |
1 |
496.9 |
201.5 |
47.4 |
76.8 |
134.9 |
8.3 |
7.8 |
264.9 |
|
|
IV |
1 |
653.4 |
4,281.8 |
5.2 |
32.3 |
133.6 |
2.3 |
7.4 |
2,748.5 |
In January, PC1 accounted for 31.38% of the total variance and showed strong positive loadings on HCO3-, Cl-, Na+, Ca2+, and Mg2+, reflecting evaporite and carbonate mineral dissolution (Cloutier et al., 2008; Mohamed et al., 2022). This pattern was observed in HCA Cluster I, where seasonal variations in Na+ and Cl- occur along PC2, explaining 28.15% of the variance, exhibited high negative loadings on SO42-, Ca2+, and Mg2+, indicating sulfate-bearing mineral dissolution, particularly gypsum weathering (Al Maliki et al., 2024; Serati et al., 2025), distinguishing Cluster II from the main population and corresponding to gypsum-affected portions of the aquifer system. PC3, contributing 21.04% of the variance, displayed dominant positive loadings for NO3- and K+, clearly indicating anthropogenic contamination from agricultural activities, aligning directly with Cluster III.
In May, PC1 (36.56%), showed strong negative loadings on HCO3-, SO42-, Ca2+, and Mg2+, indicating dilution by monsoon recharge water, leading to reduced mineralization in Cluster I. The increased variance in May compared to January reflects dominant influence of dilution process during early monsoon. PC2 (31.89%) had high loadings on CO32-, Cl-, and Na+, indicated complex mixing processes between dilute recharge and resident saline water in transitional zones. PC3 (18.90%) continued to reflect nitrate contamination but with reduced importance compared to January, suggesting partial dilution of anthropogenic contaminants.
In September, after prolonged rainfall accumulation, PC1 (35.50%) with high negative loadings on major ions (HCO3-: -0.49; Cl-: -0.46; Na+: -0.48) confirmed dilution remained the dominant process. However, DY15 and DY18 (subgroup 5) show continued mineralization despite overall freshening, demonstrating spatial heterogeneity from upward salinization from deeper saline zones. PC2 (30.67%) highlighted persistent gypsum and evaporite dissolution with strong positive loadings on SO42-, Ca2+, and Mg2+, distinguishing Cluster II (DY10, DY11). The positive loadings in September (reversed from negative in January) reflect PC orientation differences representing the same gypsum dissolution control. PC3 (15.83%) pointed to ongoing nitrate contamination but reduced variance compared to earlier periods, indicating decreased relative importance during the peak wet season due to substantial dilution.
3.5. Dominant hydrogeochemical processes
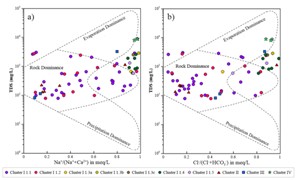
The Gibbs diagram (Figure 6) reveals distinct hydrogeochemical domains corresponding to HCA clustering results. Most samples from Cluster I (subgroups 1, 2, and 3c) and Clusters II-III plot within the rock dominance field, indicating mineral dissolution and weathering as primary controls (Gibbs, 1970). Samples from Cluster IV consistently plot within the evaporation dominance field, confirming dominance by evaporative concentration and/or halite dissolution (Luo et al., 2018) from the Maha Sarakham Formation. Cluster I subgroups 3a, 3b, 4, and 5 occupy transitional zones between rock and evaporation dominance fields, reflecting mixed processes where water-rock interactions are progressively modified by evaporative concentration or mixing with saline waters. The Gaillardet diagram (Figure 7) shows samples positioned between the silicate and evaporite end-members, with fewer trending toward the carbonate end-member, confirming that silicate weathering and evaporite dissolution as dominant processes, while carbonate weathering plays a secondary role.
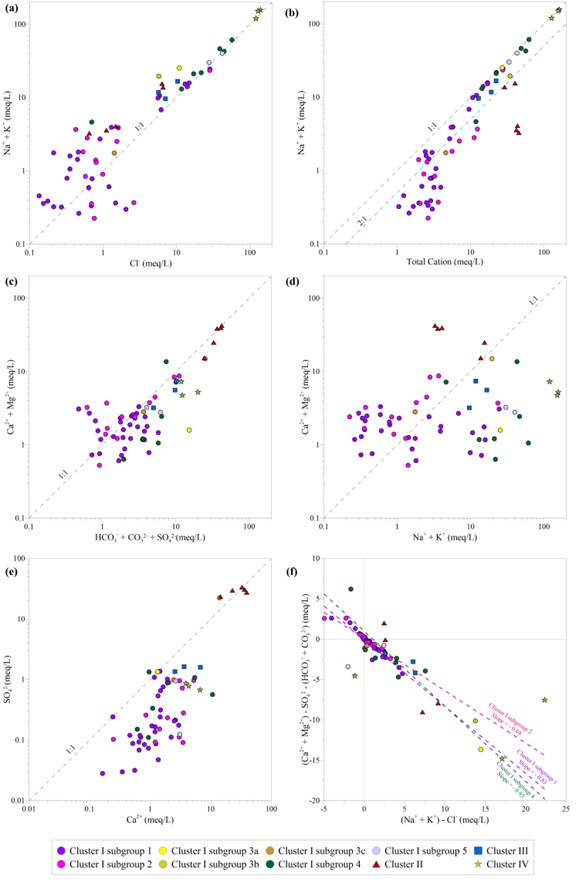
The scatter plot of Na++K+ versus Cl- (Figure 8a) is commonly employed to analyze the processes contributing to groundwater salinity (El Khalki et al., 2024; Xu et al., 2023; Khezami et al., 2024). Most samples are positioned above the 1:1 line, indicating elevated Na+ and K+ from not only halite dissolution but also from weathering of aluminosilicate minerals, which increase their concentrations relative to Cl- (Stallard & Edmond, 1983; Elango & Kannan, 2007; Razi et al., 2024).
Table 5. Principal component loadings and explained variance for the first three principal components.
|
Variable |
January |
May |
September |
||||||
|
PC1 |
PC2 |
PC3 |
PC1 |
PC2 |
PC3 |
PC1 |
PC2 |
PC3 |
|
|
HCO3- |
0.52 |
0.19 |
0.02 |
- 0.53 |
0.06 |
- 0.02 |
- 0.49 |
0.08 |
- 0.11 |
|
CO32- |
0.03 |
0.15 |
- 0.12 |
- 0.21 |
0.48 |
- 0.18 |
- 0.47 |
- 0.19 |
- 0.22 |
|
Cl- |
0.46 |
0.33 |
- 0.12 |
- 0.16 |
0.55 |
0.04 |
- 0.46 |
- 0.17 |
0.36 |
|
NO3- |
0.05 |
0.11 |
0.69 |
0.10 |
- 0.05 |
- 0.67 |
- 0.19 |
- 0.09 |
- 0.65 |
|
SO42- |
0.26 |
- 0.52 |
- 0.03 |
- 0.42 |
- 0.25 |
0.12 |
- 0.06 |
0.56 |
0.07 |
|
Ca2+ |
0.33 |
- 0.50 |
- 0.01 |
- 0.48 |
- 0.23 |
0.09 |
- 0.16 |
0.56 |
0.03 |
|
K+ |
0.10 |
0.05 |
0.69 |
- 0.13 |
- 0.05 |
- 0.69 |
- 0.12 |
0.01 |
- 0.49 |
|
Mg2+ |
0.31 |
- 0.42 |
0.07 |
- 0.43 |
- 0.23 |
- 0.09 |
- 0.17 |
0.53 |
- 0.05 |
|
Na+ |
0.48 |
0.33 |
- 0.12 |
- 0.18 |
0.54 |
0.04 |
- 0.48 |
- 0.15 |
0.35 |
|
Eigenvalue |
2.82 |
2.53 |
1.89 |
3.29 |
2.87 |
1.70 |
3.20 |
2.76 |
1.42 |
|
Variance % |
31.38 |
28.15 |
21.04 |
36.56 |
31.89 |
18.90 |
35.50 |
30.67 |
15.83 |
|
Cumulative % |
31.38 |
59.53 |
80.58 |
36.56 |
68.46 |
87.36 |
35.50 |
66.17 |
82.00 |
However, samples from highly mineralized members of Cluster I and Cluster IV plot very close to the 1:1 line, indicating that halite dissolution predominantly controls their ionic composition with minimal contribution from silicate weathering. This confirms the significance of halite dissolution in these highly salinized discharge zones, consistent with their evaporation dominance classification in the Gibbs diagram.

The influence of silicate weathering on groundwater chemistry is further assessed using the plot of Na++K+ versus total cations (TZ) in Figure 8b. Most samples plot between the 1:1 and 1:2 lines, indicating cations originate substantially from silicate weathering and/or soil salts dissolution (Sarin et al., 1989; Jalali, 2007; Aghazadeh & Mogaddam, 2011; Barzegar et al., 2017). However, many samples, particularly Cluster I subgroups 1, 2, and 3c, and Cluster II with lower total ionic concentrations, plot below the 1:2 line, suggesting alkali metal content reduction from cation exchange processes (Datta & Tyagi, 1996; Lakshmanan et al., 2003; Pradhan et al., 2022). The scatter plot of Ca2++Mg2+ versus HCO3-+SO42- in Figure 8c shows additional evidence for silicate weathering (Stallard & Edmond, 1983; Cerling et al., 1989; Elango & Kannan, 2007). The 1:1 line represents simple dissolution of calcite and gypsum, indicating charge balance between alkaline earth cations and their corresponding anions (Fisher & Mulican, 1997). Some samples plot near this line, particularly Cluster II with dominant gypsum dissolution signatures. However, most groundwater samples fall below the 1:1 line, indicating that silicate weathering either generates excess Na+ and K+ or involves reactions that consume Ca2+ and Mg2+ through reverse cation exchange, or both. This interpretation is supported by Figure 8d, which plots Ca2++Mg2+ versus Na++K+, highlighting the relative enrichment of alkali metals over alkaline earth elements (Jalali, 2007).
The scatter plot of Ca2+ versus SO42- (Figure 8e) shows most samples toward the Ca2+ side of the 1:1 line, suggesting excess calcium from sources other than sulfate minerals or reverse ion exchange processes (Zhang et al., 2022). A distinct subset, particularly Cluster II, aligns closely with the 1:1 line with high concentrations of both ions, indicating that gypsum dissolution in samples overlying the gypsum-bearing upper Khok Kruat Formation. The scatter diagram of (Ca2++Mg2+)-SO42--(HCO3-+CO32-) versus (Na++K+)-Cl- (Figure 8f) confirms the role of ion exchange in the aquifer system. If ion exchange were the only process, the relationship would be linear with a slope of -1 (Fisher & Mulican, 1997). When considering the clusters or subgroups with the largest sample populations, Cluster I subgroup 1 shows a slope of -0.83, approaching the theoretical value and indicating that ion exchange is a dominant but not exclusive process affecting groundwater chemistry in these relatively fresh recharge zone samples. Subgroup 4 exhibits an even closer approximation with a slope of -0.93, suggesting that more pronounced ion exchange processes are particularly pronounced in this transitional group where moderately saline water interacts extensively with clay-rich aquifer materials. In contrast, subgroup 2 displays a slope of -0.64, indicating that ion exchange plays a less dominant role compared to other hydrogeochemical processes such as mineral dissolution or seasonal mixing with dilute recharge water. Some samples plot near zero on both axes, suggesting groundwater composition largely unaffected by ion exchange (Karunanidhi et al., 2020; Fijani et al., 2017). Conversely, other samples plot in the positive quadrant of Figure 8f, indicating reverse ion exchange. This reverse exchange typically occurs when fresher water recharges previously saline areas.
3.6. Seasonal variations in hydrogeochemical processes
Seasonal variations in groundwater chemistry reflect monsoon-driven recharge patterns with distinct spatial responses across hydrogeological settings. The most prominent seasonal pattern is dilution during the wet season, evidenced by decreasing TDS. Average TDS decreases from 1,352 mg/L in January to 1,155 mg/L in May and 1,067 mg/L in September, indicating progressive freshening as monsoon recharge advances. However, persistently high standard deviations demonstrate spatial heterogeneity remains pronounced.
PCA quantifies seasonal shifts in controlling processes. PC1 variance increases from dry to peak wet season as loadings shift from mixed Na-Cl-HCO3 signature to carbonate-dominant processes, reflecting enhanced carbonate weathering as fresh recharge intensifies water-rock interaction. PC2 variance peaks during early monsoon with strong evaporite signature, clearly distinguishing areas with sustained halite dissolution from those dominated by seasonal carbonate weathering. By late wet season, both components return toward intermediate patterns, indicating re-equilibration as recharge decreases.
Hydrochemical facies evolution further illustrates seasonal dynamics. Ca-HCO3 facies shows the greatest seasonal variation, increasing from 23% in January to 33% in May before declining to 27% in September, reflecting enhanced carbonate weathering during peak monsoon recharge. In contrast, Na-Cl and Ca-SO4 facies maintain consistent proportions (36-38% and ~14%, respectively) across all periods, indicating sustained evaporite influence regardless of seasonal conditions. Notably, Na-HCO3 facies appears exclusively during the dry season and disappears in wet periods, suggesting specific processes under low-recharge conditions.
3.7. Anthropogenic impacts on groundwater chemistry
Anthropogenic impacts on groundwater chemistry, characterized by Cluster III samples distributed in the southern part of the study area, are distinguished by elevated NO3- concentrations, indicating significant contamination likely from nitrogen-based fertilizers. The spatial distribution of Cluster III coincides with areas of intensive farming, where chemical fertilizer and manure application are most intensive. For instance, sample DY14 (a representative of Cluster III) was collected from a shallow dug well situated in a residential area with vegetable gardening and domestic animal rearing, clearly illustrating the influence of human activity on groundwater quality. Strong correlations between NO3- and K+ are observed during dry periods (r = 0.87 in January) but these weaken significantly during the wet season (r = 0.22 in September), suggesting that although rainfall dilutes the contamination, its source remains associated with agriculture. PCA results support these source interpretations across all sampling periods. PC3 consistently shows high positive loadings of NO3- and K+ (Table 5), explaining 15.83-21.04% of total variance and confirming that surface-derived agricultural contaminants represent a distinct and independent factor controlling groundwater chemistry, separate from natural geochemical processes captured by PC1 and PC2.
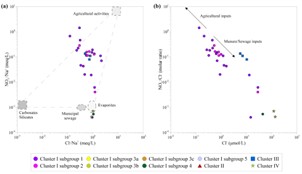
However, agriculture is not the only source of nitrate contamination, as domestic sewage, industrial discharge, landfills, and natural sources can also contribute (Pastén-Zapata et al., 2014; Torres-Martínez et al., 2020; Jia & Qian, 2025). The NO3-/Na+ versus Cl-/Na+ plot (Figure 9a) can be used to identify source of nitrate contaminations (Fan et al., 2014; Amiri et al., 2023). Most samples from Cluster I subgroups 1 and 2, as well as Cluster III, plot closely to the agricultural end-member field, confirming strong anthropogenic impact, while some samples to near the evaporite end-member suggest a background contribution from halite dissolution. The plot NO3-/Cl- versus Cl- (Figure 9b) shows high Cl- and low NO3-/Cl- ratios indicating manure or sewage impact, while high NO3-/Cl- and low Cl- suggest agricultural sources (Biddau et al., 2023; Jia & Qian, 2025). Most samples show NO3-/Cl- ratios less than 1, and when combined with the strong correlation between NO3- and K+, this pattern indicates that organic manure and potassium-bearing fertilizers represent the primary nitrate sources.
The persistence of nitrate contamination despite substantial seasonal recharge has important implications for groundwater management. Even in September when average TDS decreases by 21% compared to January, nitrate concentrations in Cluster III show minimal decline (50.3 mg/L in January versus 47.4 mg/L in September), indicating continuous agricultural loading maintains elevated concentrations regardless of dilution. This temporal stability suggests nitrate has accumulated in vadose zone materials and is continuously released to groundwater through ongoing mineralization and leaching.
4. CONCLUSIONS
This study provides a comprehensive assessment of groundwater hydrogeochemistry and salinization processes in Dang Yai Subdistrict, Khon Kaen Province, northeastern Thailand, through an integrated spatial-temporal approach combining conventional hydrogeochemical analysis with multivariate statistical methods (HCA and PCA) across three seasonal periods: January (dry season), May (early wet season), and September (peak wet season). The integrated methodology successfully identified four hydrogeochemical clusters with multiple subgroups, revealing that groundwater chemistry is controlled by complex interactions between geological factors, seasonal recharge patterns, and anthropogenic activities, with their relative importance varying significantly across seasons.
Natural salinization processes exert primary control, with evaporite minerals from the Maha Sarakham Formation creating persistent salinization in discharge zones. Cluster IV, overlying anticlinal structures with shallow rock salt, maintained extreme salinity with only 13% seasonal reduction (Cl-: 4,923 to 4,282 mg/L), confirming that deep-sourced halite dissolution overrides surface dilution effects. Cluster II demonstrated sulfate-rich signatures controlled by gypsum dissolution from the thin horizons in the upper Khok Kruat Formation, representing a distinct geochemical domain independent of the dominant halite dissolution system. Monsoon recharge acts as a powerful modulating influence in shallow aquifer systems, with 64% of Cluster I subgroup 1 samples migrating to the dilute subgroup 2 by September, demonstrating widespread seasonal freshening in recharge areas. Average TDS decreased progressively from 1,352 mg/L (January) to 1,067 mg/L (September), reflecting 21% overall dilution. This dilution was driven mainly by mixing within the saline groundwater derived from halite in the Maha Sarakham Formation, whereas the parallel 12.1% rise in calcium reflects reactive gypsum and carbonate dissolution from the shallower Khok Kruat Formation, where undersaturated recharge water continued to dissolve minerals rather than simply dilute them. However, the emergence of Cluster I subgroup 5 during the wet-season at DY15 and DY18 reveals localized vulnerability zones where deep saline water migrates upward along structural pathways. These sites maintained extreme Cl- concentrations despite regional dilution trends, demonstrating that salinization processes operate with significant spatial heterogeneity even under uniform climatic forcing.
Hydrochemical facies evolution confirms these dynamics: Ca-HCO3 facies increased from 23% (January) to 33% (May) before declining to 27% (September), reflecting enhanced carbonate weathering during monsoon transition followed by dilution during peak rainfall. Na-HCO3 facies appeared exclusively during the dry season, indicating specific cation exchange processes under low-recharge, extended residence time conditions. In contrast, Na-Cl and Ca-SO4 facies maintained consistent proportions (36-38% and ~14%, respectively) across all periods, demonstrating that evaporite-controlled zones resist seasonal modification. PCA decomposed over 80% of total variance across all seasons, quantifying the relative importance of controlling processes. PC1 variance increased from 31.38% (January) to 36.56% (May), reflecting a transition from mixed mineral dissolution processes to dominant dilution as the primary source of chemical variability. PC2 (28.15 - 31.89%) confirmed strong evaporite dissolution signatures regardless of season, distinguishing saline discharge zones from freshwater recharge areas. PC3 (15.83 - 21.04%) consistently isolated anthropogenic contamination as an independent factor, separate from natural geochemical processes.
Anthropogenic contamination (Cluster III) demonstrated remarkable temporal persistence, with NO3- declining only 5.8% (50.3 to 47.4 mg/L) despite 21% overall TDS reduction, reflecting vadose zone accumulation and continuous release from organic manure and potassium fertilizers. Strong NO3--K+ correlations during the dry season (r = 0.87) weakening in the wet season (r = 0.22) confirm agricultural sources with seasonal dilution but persistent loading.
Study limitations include the restricted spatial scale within a single small subdistrict, limited access to shallow aquifer systems due to well abandonment and backfilling from salinity problems. The single-year sampling period cannot capture inter-annual variability in hydrogeochemical processes. Moreover, sampling was conducted in 2023, a year classified as a strong El Niño event in Northeast Thailand, in contrast to the moderate La Niña conditions of preceding years (Prasertsri et al., 2026). El Niño years in this region are associated with delayed monsoon onset and reduced rainfall. The seasonal dynamics reported here, including the magnitude of wet-season dilution and recovery observed in September, may not fully represent a climatologically average or La Niña-influenced year. Furthermore, the absence of stable isotope data prevented definitive verification of recharge sources, evaporation effects, and geochemical pathways. Future research should prioritize expanded stable isotope analyses to quantify recharge mechanisms and distinguish between natural and anthropogenic nitrate sources. Detailed aquifer mineralogy and sediment geochemistry studies are needed to constrain water-rock interaction pathways. Multi-year monitoring programs should be established to assess inter-annual variations and long-term salinization trends. Finally, three-dimensional numerical flow and reactive transport modeling is essential to quantify salinization rates under different abstraction scenarios and evaluate management strategies under projected climate change.
Effective management in evaporite-influenced aquifer systems under tropical monsoon climates requires integrated implementation of multiple strategies. Dedicated piezometer networks with quarterly stable isotope monitoring and continuous hydraulic head measurements should be installed in vulnerability zones showing wet-season salinization (DY15 and DY18) to detect early-warning signals of saline water migration. Agricultural areas require targeted best management practices to reduce vadose zone accumulation in contamination hotspots (Cluster III). Seasonal abstraction regulation in transitional zones (Cluster I subgroups 4-5) during dry periods, combined with land use controls protecting shallow aquifers in recharge areas (Cluster I subgroups 1-2), are essential to prevent saline water migration and maintain freshwater resources.
This integrated hydrogeochemical framework provides a replicable methodology for evaporite-influenced aquifers in tropical monsoon regions globally. The findings establish critical baseline data supporting evidence-based management under water security pressures from population growth, agricultural intensification, and climate change, addressing knowledge gaps in previous single-season studies and providing quantitative insights into temporal salinization dynamics essential for sustainable development in northeastern Thailand and similar settings worldwide.
ACKNOWLEDGMENT
This research is funded by the Young Researcher Development Project of Khon Kaen University Year 2023. The authors would like to thank the Department of Geotechnology and the staff for their support in providing laboratory resources. Special thanks to Thanakrit Klungudom and Munlika Srichalee for their assistance in collecting and analyzing the samples.
REFERENCES
- Aghazadeh, N. & Mogaddam, A.A., 2011. Investigation of hydrochemical characteristics of groundwater in the Harzandat aquifer Northwest of Iran. Environmental Monitoring and Assessment, 176(1), 183-195. https://doi.org/10.1007/s10661-010-1575-4
- Al Maliki, A., Kumar, U.S., Falih, A.H., Sultan, M.A., Al-Naemi, A., Arman, D., Ahmed, A. & Sabarathiham, C., 2024. Geochemical processes, salinity sources and utility characterization of groundwater in a semi-arid region of Iraq through geostatistical and isotopic techniques. Environmental Monitoring and Assessment, 196(4), 365. https://doi.org/10.1007/s10661-024-12533-1
- Amiri, V., Sohrabi, N., Li, P. & Amiri, F., 2023. Groundwater quality for drinking and non-carcinogenic risk of nitrate in urban and rural areas of Fereidan, Iran. Exposure and Health, 15(4), 807-823. https://doi.org/10.1007/s12403-022-00525-w
- Arjwech, R., Everett, M.E. & Wanakao, P., 2019. The relationship between geological factors and the distribution of saline soil: a case study in the Khon Kaen Basin of Thailand. Songklanakarin Journal of Science & Technology, 41(5), 974-983.
- Arunin, S. & Pongwichian, P., 2015. Salt-affected soils and management in Thailand. Bulletin of the Society of Sea Water Science, Japan, 69, 319-325.
- Baird, R.B., Eaton, A.D. & Rice, E.W. (Eds), 2017. Standard Methods for the Examination of Water and Wastewater, 23rd Edition. American Public Health Association, American Water Works Association, Water Environment Federation, Washington DC, USA.
- Barzegar, R., Moghaddam, A.A., Tziritis, E., Fakhri, M.S. & Soltani, S., 2017. Identification of hydrogeochemical processes and pollution sources of groundwater resources in the Marand plain, northwest of Iran. Environmental Earth Sciences, 76, 297. https://doi.org/10.1007/s12665-017-6612-y
- Biddau, R., Dore, E., Da Pelo, S., Lorrai, M., Botti, P., Testa, M. & Cidu, R., 2023. Geochemistry, stable isotopes and statistic tools to estimate threshold and source of nitrate in groundwater (Sardinia, Italy). Water Research, 232, 119663. https://doi.org/10.1016/j.watres.2023.119663
- Cerling, T.E., Pederson, B.L. & Von Damm, K.L., 1989. Sodium-calcium ion exchange in the weathering of shales: implications for global weathering budgets. Geology, 17(6), 552-554. https://doi.org/10.1130/0091-7613(1989)017<0552:SCIEIT>2.3.CO;2
- Cloutier, V., Lefebvre, R., Therrien, R. & Savard, M.M., 2008. Multivariate statistical analysis of geochemical data as indicative of the hydrogeochemical evolution of groundwater in a sedimentary rock aquifer system. Journal of Hydrology, 353, 294-313. https://doi.org/10.1016/j.jhydrol.2008.02.015
- Datta, P.S. & Tyagi, S.K., 1996. Major ion chemistry of groundwater in Delhi area: chemical weathering processes and groundwater flow regime. Journal Geological Society of India, 47(2), 179-188.
- Department of Groundwater Resources (DGR), 2017. Groundwater potential map of Khon Kaen Province, scale 1:100,000. Ministry of Natural Resources and Environment, Bangkok, Thailand.
- Department of Mineral Resources (DMR), 2009. Geologic map of Changwat Khon Kaen Province, scale 1:250,000. Ministry of Natural Resources and Environment, Bangkok, Thailand.
- Dissataporn, C., Yacouba, K., Mihara, M. & Yasutomi, R., 2002. Effect of groundwater level on salinity content and environmental land classification. Journal of the Japanese Society of Soil Physics, 89, 35-42. https://doi.org/10.34467/jssoilphysics.89.0_35
- Durov, S.A., 1948. Natural waters and graphic representation of their composition. Dokl Akad Nauk SSSR, 59(3), 87-90.
- Eamrat, R., Lapkratok, S., Mingyai, S. & Shakya, B.M., 2022. Assessment of groundwater quality for irrigation purposes: a case study of Suwannaphum district, Roi-et, Thailand. Geomate Journal, 23(97), 106-114. https://doi.org/10.21660/2022.97.3280
- Elango, L. & Kannan, R., 2007. Rock-water interaction and its control on chemical composition of groundwater. Developments in Environmental Science, 5, 229-243. https://doi.org/10.1016/S1474-8177(07)05011-5
- El khalki, S., Ghalit, M., Elbarghmi, R., Azzaoui, K., Jodeh, S., Hanbali, G. & Lamhamdi, A., 2024. Identification of hydrochemical processes of groundwater in Nekor-Ghiss plain (Morocco): using the application of multivariate statistics and Geographic Information Systems (GIS) to map groundwater. Applied Water Science, 14, 166. https://doi.org/10.1007/s13201-024-02220-4
- El Tabakh, M., Utha-Aroon, C. & Schreiber, B.C., 1999. Sedimentology of the Cretaceous Maha Sarakham evaporates in the Khorat Plateau of northeastern Thailand. Sedimentary Geology, 123, 31-62. https://doi.org/10.1016/S0037-0738(98)00083-9
- Fan, B.L., Zhao, Z.Q., Tao, F.X., Liu, B.J., Tao, Z.H., Gao, S. & Zhang, L.H., 2014. Characteristics of carbonate, evaporite and silicate weathering in Huanghe River basin: A comparison among the upstream, midstream and downstream. Journal of Asian Earth Sciences, 96, 17-26. https://doi.org/10.1016/j.jseaes.2014.09.005
- Ferchichi, H., Ben Hamouda, M.F., Farhat, B. & Ben Mammou, A., 2018. Assessment of groundwater salinity using GIS and multivariate statistics in a coastal Mediterranean aquifer. International Journal of Environmental Science and Technology, 15, 2473-2492. https://doi.org/10.1007/s13762-018-1767-y
- Fijani, E., Moghaddam, A.A., Tsai, F.T.C. & Tayfur, G., 2017. Analysis and assessment of hydro-chemical characteristics of Maragheh-Bonab plain aquifer, northwest of Iran. Water Resources Management, 31, 765-780. https://doi.org/10.1007/s11269-016-1390-y
- Fisher, R.S. & Mulican, W.F. III, 1997. Hydrochemical evolution of sodium-sulphate and sodium-chloride groundwater beneath the Northern Chihuahuan desert, Trans-Pecos, Texas, USA. Hydrogeology Journal, 10(4), 455-474. https://doi.org/10.1007/s100400050102
- Gaillardet, J., Dupré, B., Louvat, P. & Allegre, C., 1999. Global silicate weathering and CO2 consumption rates deduced from the chemistry of large rivers. Chemical Geology, 159(1-4), 3-30. https://doi.org/10.1016/S0009-2541(99)00031-5
- Gibbs, R.J., 1970. Mechanisms controlling world water chemistry. Science, 170(3962), 1088-1090. https://doi.org/10.1126/science.170.3962.1088
- Güler, C., Thyne, G.D., McCray, J.E. & Turner, A.K., 2002. Evaluation of graphical and multivariate statistical methods for classification of water chemistry data. Hydrogeology Journal, 10(4), 455-474. https://doi.org/10.1007/s10040-002-0196-6
- Jalali, M., 2007. Salinization of groundwater in arid and semiarid zones: An example from Tajarak, western Iran. Environmental Geology, 52(6), 1133-1149. https://doi.org/10.1007/s00254-006-0551-3
- Jia, H. & Qian, H., 2025. Groundwater nitrate response to hydrogeological conditions and socioeconomic load in an agriculture dominated area. Scientific Reports, 15(1), 1315. https://doi.org/10.1038/s41598-024-84318-y
- Jia, Y., Guo, H., Xi, B., Jiang, Y., Zhang, Z., Yuan, R., Yi, W. & Xue, X., 2017. Sources of groundwater salinity and potential impact on arsenic mobility in the western Hetao Basin, Inner Mongolia. Science of the Total Environment, 601, 691-702. https://doi.org/10.1016/j.scitotenv.2017.05.196
- Jiang, Y., Guo, H., Jia, Y., Cao, Y. & Hu, C., 2015. Principal component analysis and hierarchical cluster analyses of arsenic groundwater geochemistry in the Hetao basin, Inner Mongolia. Geochemistry, 75, 197-205. https://doi.org/10.1016/j.chemer.2014.12.002
- Karunanidhi, D., Aravinthasamy, P., Deepali, M., Subramani, T. & Roy, P.D., 2020. The effects of geochemical processes on groundwater chemistry and the health risks associated with fluoride intake in a semi-arid region of South India. RSC Advances, 10(8), 4840-4859. https://doi.org/10.1039/c9ra10332e
- Khezami, F., Khiari, N., Drouiche, A., Chkirbene, A., Zahi, F., Debieche, T.H. & Khadhar, S., 2024. Hydrogeochemical assessment and modeling of groundwater processes and pollution: A case study of the Grombalia aquifer in Northeast Tunisia. Modeling Earth Systems and Environment, 10(3), 3573-3592. https://doi.org/10.1007/s40808-024-01968-7
- Lakshmanan, E., Kannan, K. & Senthil Kumar, M., 2003. Major ion chemistry and identification of hydrogeochemical process of groundwater in part of Kancheepuram district, Tamilnadu, India. Journal of Environmental Geosciences, 10, 157-166.
- Land Development Department, 2022. Land use map of Khon Kaen Province. Available at: http://www1.ldd.go.th/web_OLP/Lu_65/Lu65_NE/KKN2565.htm
- Lertsirivorakul, R., Kaenkeo, W. & Youngmee, W., 1984. Study on salinity of surface, subsurface and groundwater of Amphoe Muang, Khon Kaen. Research Report, Khon Kaen University, Thailand.
- Lertsirivorakul, R., Milne-Home, W.A. & Knight, M.J., 1995. Occurrence and Origin of Nitrate in Groundwater within the Khon Kaen Region, Northeast Thailand. In: Proceeding of International Conference on Geology, Geotechnology and Mineral Resources of Indochina, Khon Kaen University, Khon Kaen, Thailand, 665-673.
- Li, C., Gao, X., Li, S. & Bundschuh, J., 2020. A review of the distribution, sources, genesis, and environmental concerns of salinity in groundwater. Environmental Science and Pollution Research, 27, 41157-41174. https://doi.org/10.1007/s11356-020-10354-6
- Lloyd, J.W. & Heathcote, J.A., 1985. Natural inorganic chemistry in relation to groundwater. Clarendon Press, Oxford.
- Lorenzen, G., Sprenger, C. & Baudron, P., 2012. Origin and dynamics of groundwater salinity in the alluvial plains of western Delhi and adjacent territories of Haryana State, India. Hydrological Processes, 26(15), 2333-2345. https://doi.org/10.1002/hyp.8311
- Luo, W., Gao, X. & Zhang, X., 2018. Geochemical processes controlling the groundwater chemistry and fluoride contamination in the Yuncheng Basin, China - An area with complex hydrogeochemical conditions. PLOS ONE, 13(7), e0199082. https://doi.org/10.1371/journal.pone.0199082
- Merchán, D., Auqué, L.F. & Acero, P., 2015. Geochemical processes controlling water salinization in an irrigated basin in Spain: identification of natural and anthropogenic influence. Science of the Total Environment, 502, 330-343. https://doi.org/10.1016/j.scitotenv.2014.09.041
- Mohamed, A., Asmoay, A. & Alshehri, F., 2022. Hydro-geochemical applications and multivariate analysis to assess the water–rock interaction in arid environments. Applied Sciences, 12(6343), 1-13. https://doi.org/10.3390/app12136340
- Nettasana, T., Craig, J. & Tolson, B., 2012. Conceptual and numerical models for sustainable groundwater management in the Thaphra area, Chi River Basin, Thailand. Hydrogeology Journal, 20(7), 1355-1374. https://doi.org/10.1007/s10040-012-0887-6
- Ongsomwang, S., Pattanakiat, S. & Srisuwan, A., 2019. Impact of land use and land cover change on ecosystem service values: A case study of Khon Kaen City, Thailand. Environment and Natural Resources Journal, 17(4), 43-58. https://doi.org/10.32526/ennrj.17.4.2019.30
- Panagiotou, C.F., Kyriakidis, P. & Tziritis, E., 2022. Application of geostatistical methods to groundwater salinization problems: a review. Journal of Hydrology, 615, 128566. https://doi.org/10.1016/j.jhydrol.2022.128566
- Pastén-Zapata, E., Ledesma-Ruiz, R., Harter, T., Ramírez, A.I. & Mahlknecht, J., 2014. Assessment of sources and fate of nitrate in shallow groundwater of an agricultural area by using a multi-tracer approach. Science of the Total Environment, 470, 855-864. https://doi.org/10.1016/j.scitotenv.2013.10.043
- Patcharapreecha, P., Topark-Ngarm, B., Goto, I. & Kimura, M., 1989. Studies on saline soils in Khon Kaen region, Northeast Thailand I Physical and chemical properties of saline soils. Soil Science and Plant Nutrition, 35(2), 171-179. https://doi.org/10.1080/00380768.1989.10434751
- Pholkern, K., Saraphirom, P. & Srisuk, K., 2018. Potential impact of climate change on groundwater resources in the Central Huai Luang Basin, Northeast Thailand. Science of the Total Environment, 633, 1518-1535. https://doi.org/10.1016/j.scitotenv.2018.03.300
- Piper, A.M., 1944. A graphic procedure in the geochemical interpretation of water-analyses. Eos, Transactions American Geophysical Union, 25(6), 914-928. https://doi.org/10.1029/TR025i006p00914
- Posit team, 2025. RStudio: Integrated Development Environment for R. Posit Software, PBC, Boston, MA. URL http://www.posit.co/.
- Pradhan, R.M., Behera, A.K., Kumar, S., Kumar, P. & Biswal, T.K., 2022. Recharge and geochemical evolution of groundwater in fractured basement aquifers (NW India): insights from environmental isotopes (δ18O, δ2H, and 3H) and hydrogeochemical studies. Water, 14(3), 315. https://doi.org/10.3390/w14030315
- Prasertsri, N., Littidej, P., Pumhirunroj, B., & Slack, D., 2026. Remote Sensing Indices for Drought Characterization in Northeast Thailand: Provisional Descriptive Reference Points and Implications for Drought Monitoring. Sustainability, 18(14), 7490. https://doi.org/10.3390/su18147490
- Racey, A., Love, M.A., Canham, A.C., Goodall, J.G.S., Polachan, S. & Jones, P.D., 1996. Stratigraphy and reservoir potential of the Mesozoic Khorat Group, NE Thailand: Part 1: stratigraphy and sedimentary evolution. Journal of Petroleum Geology, 19(1), 5-39. https://doi.org/10.1111/j.1747-5457.1996.tb00511.x
- Rahbar, A., Vadiati, M., Talkhabi, M., Nadiri, A.A., Nakhaei, M. & Rahimian, M., 2020. A hydrogeochemical analysis of groundwater using hierarchical clustering analysis and fuzzy C-mean clustering methods in Arak plain, Iran. Environmental Earth Sciences, 79, 1-17. https://doi.org/10.1007/s12665-020-09064-6
- Ramnarong, V. & Buapeng, S., 1985. Groundwater Quality Problems in Thailand. Journal of Geological Society of Thailand, 8, 37-42.
- Razi, M.H., Wilopo, W. & Putra, D.P.E., 2024. Hydrogeochemical evolution and water-rock interaction processes in the multilayer volcanic aquifer of Yogyakarta-Sleman Groundwater Basin, Indonesia. Environmental Earth Sciences, 83(6), 164. https://doi.org/10.1007/s12665-024-11477-6
- Richter, B.C. & Kreitler, C.W., 1993. Geochemical techniques for identifying sources of groundwater salinization. CRC Press, Boca Raton.
- Said, I., Salman, S.A. & Elnazer, A.A., 2022. Salinization of groundwater during 20 years of agricultural irrigation, Luxor, Egypt. Environmental Geochemistry and Health, 44, 3821-3835. https://doi.org/10.1007/s10653-021-01135-2
- Salama, R.B., Otto, C.J. & Fitzpatrick, R.W., 1999. Contributions of groundwater conditions to soil and water salinization. Hydrogeology Journal, 7(1), 46-64. https://doi.org/10.1007/s100400050179
- Saraphirom, P., Wirojanagud, W. & Srisuk, K., 2013. Potential impact of climate change on area affected by waterlogging and saline groundwater and ecohydrology management in northeast Thailand. EnvironmentAsia, 6(1), 19-28. https://doi.org/10.14456/ea.2013.4
- Sarin, M.M., Krishnaswamy, S., Dilli, K., Somayajulu, B.L.K. & Moore, W.S., 1989. Major ion chemistry of the Ganga-Brahmaputra River system: weathering processes and fluxes to the Bay of Bengal. Geochimica et Cosmochimica Acta, 53(5), 997-1009. https://doi.org/10.1016/0016-7037(89)90205-6
- Satarugsa, P., Youngmee, W. & Meesawat, S., 2005. New regional boundary of Maha Sarakham Formation in the Northeastern Thailand: results from 2D seismic mapping. In: Proceeding of International Conference on Geology, Geotechnology and Mineral Resources of Indochina, Khon Kaen University, Khon Kaen, Thailand, 28-30.
- Sattayarak, N., 1983. Review of the continental Mesozoic stratigraphy of Thailand. In: Workshop on Stratigraphic Correlation of Thailand and Malaysia, Haad Yai, Thailand, 127-140.
- Selmane, T., Dougha, M., Hasbaia, M., Ferhati, A. & Redjem, A., 2022. Hydrogeochemical processes and multivariate analysis for groundwater quality in the arid Maadher region of Hodna, northern Algeria. Acta Geochimica, 41(5), 893-909. https://doi.org/10.1007/s11631-022-00553-y
- Serati, P., Sadatinejad, S.J., Yousefi, H. & Mirzavand, M., 2025. Delineating the effect of water/rock–water/clay interactions and ion exchange in groundwater and soil salinization in an arid and semi-arid region of Iran. Environmental Earth Sciences, 84(14), 405. https://doi.org/10.1007/s12665-025-12402-1
- Srisuk, K. & Nettasana, T., 2017. Climate change and groundwater resources in Thailand. Journal of Groundwater Science and Engineering, 5(1), 67-75. https://doi.org/10.26599/JGSE.2017.9280007
- Stallard, R.F. & Edmond, J.M., 1983. Geochemistry of the Amazon: 2. The influence of geology and weathering environment on the dissolved load. Journal of Geophysical Research: Oceans, 88(C14), 9671-9688. https://doi.org/10.1029/JC088iC14p09671
- Subba Rao, N., 2008. Factors controlling the salinity in groundwater in parts of Guntur district, Andhra Pradesh, India. Environmental Monitoring and Assessment, 138, 327-341. https://doi.org/10.1007/s10661-007-9801-4
- Torres-Martínez, J.A., Mora, A., Knappett, P.S., Ornelas-Soto, N. & Mahlknecht, J., 2020. Tracking nitrate and sulfate sources in groundwater of an urbanized valley using a multi-tracer approach combined with a Bayesian isotope mixing model. Water Research, 182, 115962. https://doi.org/10.1016/j.watres.2020.115962
- Udomsilpa, P., 2004. A spatial modeling for groundwater potential using geographic information system: a case study in Amphoe Muang, Khon Kaen Province. M.S. Thesis, Khon Kaen University, Thailand.
- Utha-Aroon, C., 1993. Continental origin of the Maha Sarakham evaporites, northeastern Thailand. Journal of Southeast Asian Earth Sciences, 8, 193-206. https://doi.org/10.1016/0743-9547(93)90021-G
- Van Ninh, T. & Waisurasingha, C., 2018. Land use/cover change and landscape fragmentation analyses in Khon Kaen city, Northeastern Thailand. GEOMATE Journal, 15(47), 201-208. https://doi.org/10.21660/2018.47.SGI174
- Walter, J., Chesnaux, R., Cloutier, V. & Gaboury, D., 2017. The influence of water/rock - water/clay interactions and mixing in the salinization processes of groundwater. Journal of Hydrology: Regional Studies, 13, 168-188. https://doi.org/10.1016/j.ejrh.2017.07.004
- Wen, X., Wu, Y., Su, J., Zhang, Y. & Liu, F.J., 2005. Hydrochemical characteristics and salinity of groundwater in the Ejina Basin, Northwestern China. Environmental Geology, 48(6), 665-675. https://doi.org/10.1007/s00254-005-0001-7
- Wongsomsak, S., 1986. Salinization in northeast Thailand. Japanese Journal of Southeast Asian Studies, 24(2), 133-153. https://doi.org/10.20495/tak.24.2_133
- Xu, F., Li, P., Du, Q., Yang, Y. & Yue, B., 2023. Seasonal hydrochemical characteristics, geochemical evolution, and pollution sources of Lake Sha in an arid and semiarid region of Northwest China. Exposure and Health, 15(1), 231-244. https://doi.org/10.1007/s12403-022-00488-y
- Yoshida, K., Sritumboon, S., Srisutham, M., Homma, K., Maki, M. & Oki, K., 2021. Climate change impact on soil salt accumulation in Khon Kaen, Northeast Thailand. Hydrological Research Letters, 15(4), 92-97.
- Zhang, X., Zhao, R., Wu, X. & Mu, W., 2022. Hydrogeochemistry, identification of hydrogeochemical evolution mechanisms, and assessment of groundwater quality in the southwestern Ordos Basin, China. Environmental Science and Pollution Research, 29, 901-921. https://doi.org/10.1007/s11356-021-15643-2.