
1. INTRODUCTION
All living organisms are continuously exposed to natural background radiation through several exposure pathways, including ingestion of food and drinking water and inhalation of naturally occurring radioactive gases (Jha et al 2024).
Radon (²²²Rn) originates from the radioactive decay of radium (²²⁶Ra) and has a half-life of 3.8 days. Radon is a colorless, odorless, tasteless, and chemically inert noble gas. Its radioactive decay produces a series of short-lived radioactive progeny accompanied by alpha-particle emissions (Vorobeva & Gaevaya, 2023).
Radon migrates through pores and fractures and can dissolve in groundwater (Appleton, 2012). The extent of radon dissolution depends on local geological formations, uranium and radium content, groundwater residence time, and hydrogeological conditions. The carcinogenic effects of radon, which may lead to lung and gastrointestinal cancers, are receiving increasing attention from researchers (Liu et al., 2024). Human exposure to radon dissolved in water occurs through two principal pathways: inhalation of radon released into indoor air during domestic water use and direct ingestion through drinking water (Grzywa et al., 2020; Dobrzyńska et al., 2023). The demand for drinking water is increasing, mainly due to population growth and urbanization. Ingestion of water containing radon may be the primary source of exposure to human organs other than the lungs (Madhav et al., 2020). Various studies have also shown that long-term inhalation and ingestion of radon present in the drinking water can lead to pathological effects such as respiratory functional changes and DNA damage in sensitive lung tissues, leading to lung, stomach, and digestive tract cancer (Maier et al., 2020). Epidemiological studies have also shown that the ingestion of radon over a considerable period of time may be responsible for stomach and gastrointestinal cancers (Barbosa-Lorenzo et al., 2017). Although the risk of lung cancer due to radon inhalation is now widely recognized, the possible health impacts of ingesting water containing radon appear to be less well documented (Vogiannis & Nikolopoulos, 2015). It is imperative to measure, monitor, and control radon in water constantly to protect the human population from internal exposure that may result from inhalation and ingestion of radon present in the water (Bulut & Şahin, 2024). This has sparked interest in research focused on the drinking water quality of the Djiri River in Congo. The highest organ dose due to ingested radon is the one that affects the stomach, receiving more than 90% of the total effective dose (Kendall & Smith, 2002). Despite increasing international interest in radon contamination of drinking water, no systematic investigation has previously been conducted on river water in the Republic of Congo. The Djiri River constitutes an important freshwater resource because it supplies a significant proportion of the drinking water distributed to the population of Brazzaville. Moreover, many riverside communities use its water directly for drinking and domestic purposes, making the evaluation of its radiological quality particularly relevant for public health.
The Djiri River flows through the northern part of Brazzaville within the Stanley Pool sedimentary basin and the Batéké Plateau geological system. The subsurface is mainly composed of poorly consolidated siliciclastic continental deposits and sandy formations containing more than 95% fine sand. These geological formations are highly permeable and susceptible to erosion, conditions that may influence groundwater circulation, groundwater–surface water interactions, and consequently the occurrence and transport of dissolved radon. The river also flows through densely populated areas undergoing rapid urban expansion, further emphasizing its environmental and public health importance.
Because dissolved radon is invisible, chemically inert, and spatially variable, direct measurement is essential for reliable radiological risk assessment. Moreover, other studies have analyzed the radionuclides present in riverbed sediments (Coţac et al., 2024). Furthermore, this study represents the first investigation of radon in river water conducted in the Republic of Congo, providing baseline data for future environmental monitoring and radiological protection studies.
Therefore, this study aimed to measure radon concentration in water samples collected from the Djiri River using an AlphaGUARD detector, estimate equivalent and effective radiation doses for different age groups, assess lifetime cancer mortality risks associated with radon ingestion, evaluate the contribution of inhalation resulting from radon released during domestic water use, and compare the obtained results with internationally accepted radiological protection guidelines.
2. MATERIALS AND METHODS
2.1. Study area
The present study was conducted along the Djiri River, a tributary of the Congo River located in the northern part of Brazzaville, Republic of Congo. The Djiri River is one of the principal freshwater resources supplying drinking water to the city through the La Congolaise des Eaux (LCDE) distribution network. In addition, many riverside communities use its water directly for drinking and various domestic activities, making the assessment of its radiological quality particularly relevant for public health.
The Djiri River extends over approximately 65km and drains a watershed of about 853 km2. It originates south of the Mbé Plateau and flows through the Batéké Plateau before joining the Congo River (Mouzeo , 1986) . The river basin is mainly composed of unconsolidated siliciclastic continental deposits and sandy formations containing more than 95% fine sand. These highly permeable geological formations favor groundwater circulation and may influence the transport and dissolution of naturally occurring radon in water. The watershed is also affected by intense urbanization and erosion processes, which further emphasize the importance of monitoring the environmental quality of this strategic water resource.
Twenty-nine (29) water samples were collected on 1 October 2024 from representative locations distributed along the Djiri River under ambient atmospheric conditions. Samples were collected in 500 mL polyethylene bottles, which were completely filled and immediately sealed underwater without headspace in order to minimize radon degassing during sampling. The samples were transported to the Laboratory of Nuclear Physics and Applications (LPNA), National Institute for Research in Exact and Natural Sciences (IRSEN) under controlled conditions and analyzed within 24 hours of collection.
To further evaluate possible radon losses during storage, additional tests were carried out using polyethylene terephthalate (PET) bottles under identical storage conditions.
2.2. Equipment setup
The calibration of AlphaGUARD was carried out using a NIST-226Ra standard (NIST 4973#17) with an activity of 489.0 ±6.2 Bq in a 1.5 M HCl solution. Its (²²²Rn) emanation fraction was 0.98 ±0.03 at 21 °C. The polyethylene encapsulated (²²⁶Ra) solution was packed into a leak tight glass bulb where (²²²Rn) accumulates over time. AlphaGUARD was factory calibrated in SAPHYMO’s Frankfurt radon chamber (Genitron Instruments, 1998). The calibration of a factory reference unit AlphaGUARD (s/n EF-0501) at factory laboratory was traceable to NIST (²²⁶Ra) SRM-4968/CP-100 primary standard source. This unit was used as an operational transfer standard device. The calibration of the Alpha GUARD used in this work was performed at the factory against the transfer device. (²²²Rn) emanation standards, based on a liquid standard (²²⁶Ra) source from CIEMAT (Spain) (35.68±0.24Bq/g), have also been used for QC testing.
2.3. Measurement of the concentration of Rn
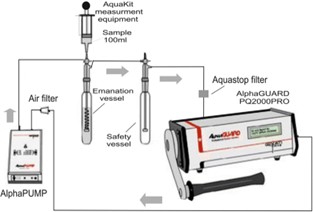
Radon concentration in water can be determined using several analytical techniques, including alpha spectrometry, gamma spectrometry, liquid scintillation counting, and portable radon monitoring systems such as the RAD7 and AlphaGUARD detectors (Rožmarić et al., 2012; Fakhri et al., 2015). Among these methods, the AlphaGUARD PQ2000 PRO has been widely used for environmental radon measurements because of its high sensitivity, measurement stability, and reliability. Therefore, in the present study, radon (222Rn) concentration in drinking water samples was measured using an AlphaGUARD PQ2000 PRO coupled with an AquaKIT degassing system.
First, 100 mL of the sample was injected into the degassing vessel using a syringe. After sample injection, the gas cycle was closed, and the air pump was switched on being radon extracted from the water and transferred to the monitor all through the closed gas cycle. All drops generated in the degassing process would go into the gas cycle, being deposited in the safety vessel. The background of the empty setup was measured for 40 min before each measurement was carried out. The flow rate of the pump was 0.3 L min 1 for 10 min. Then, the pump was turned off and the activity concentration of (²²²Rn) was recorded every 10 min for the next 40 min.
In order to determine the effects of the radioactive activity of water on the diffusion rate of radon in the stomach, measurements were carried out on samples taken from the Djiri river and processed at the Laboratory of Nuclear Physics and Applications (LPNA) at the National Institute of Research in Natural and Exact Sciences (IRSEN). The activity concentration of (²²²Rn) in the water samples was calculated using the following equation (SAPHYMO, 2007):

Where Cwater is the (²²²Rn) concentration in the water sample (Bq/m3), Cair is the (²²²Rn) concentration in the setup after expelling (²²²Rn) from water (Bq/m3), Co is empty setup background (Bq/m3), Vsystem is the interior volume of the measurement setup (ml), Vsample is the volume of the water sample (ml), and k is the (²²²Rn) distribution coefficient. The radon distribution coefficient k varies inversely with the temperature and it was calculated by the following equation (Li et al., 2015):

Where: k is the radon diffusion coefficient and, t is the water temperature (°C) (AquaKIT, 2008).
The radon emanation coefficient (k) varies depending on the temperature and decreases with increasing temperature values (with the temperature increase, the velocity of transition to gas phase from liquid phase of radon gas increase) (Şahin Bal et al., 2021).
The AlphaGUARD provided an uncertainty value to each measurement whose calculation was not well documented. The overall uncertainty of Cwater obtained using equation (1) was calculated considering the measurement uncertainties of each parameter (C0, Cair, Vsample, Vsystem, and T), as well as the uncertainty (3%) of factory calibration (Genitron Instruments, 1998). Cair and C0 where the average of the measurements recorded every 10 min, and its uncertainty was its standard deviation, (C0) and (Cair). Vsystem was provided by the manufacturer, 1102 mL with an uncertainty of (Vsample) = 11,02 mL (Saphymo, 2007). Finally, the uncertainty of the sample volume was (Vsample) =1 mL.
2.4. Calculation of the equivalent dose (ingestion)
To determine the equivalent dose received by different organs in the case of non-diffusion; the case of bases and the saturated diffusion of water in the stomach, equation (3) was used (National Research Council, Commission on Life Sciences, 1999).

where HT (Sv/L) is the equivalent dose, Cwater is the concentration of radon determined in water (Bq/L), and Ho (Sv/Bq) is the equivalent dose incurred per unit activity of ingested radon (National Research Council, Commission on Life Sciences, 1999). The effective dose (E) was calculated using equation (4).

where HT (mSv/L) is the equivalent dose of each organ, WT is the tissue weighting factor, and WC is the annual water intake, taken as 243;487; and 730 L/year for infants, children, and adults, respectively (UNSCEAR, 2000; Isola et al., 2021; Elzain et al., 2024).
2.5. Estimation of the excess cancer risk over a lifetime (ingestion)
The risk of mortality from cancer (RMC) due to water ingestion over a lifetime has been estimated using equation (5) (National Research Council, Commission on Life Sciences, 1999):

Where Cwater is the concentration of radon in water, C0 is the concentration of radon at (1 Bq/m3), and CMRI is the cancer mortality risk from lifetime ingestion of radon at a concentration of (1 Bq/m3) in water for each organ (National Research Council, Commission on Life Sciences, 1999). We have explicitly integrated the reference baseline concentration ( and the organ-specific cancer mortality risk factor (CMRI). This approach effectively normalizes all estimated risks to a uniform baseline, allowing a mathematically valid evaluation against the National Research Council (NRC) reference guidelines.
2.6. Calculation of the equivalent dose (inhalation)
The inhalation dose attributable to radon released from the Djiri river water consumed by the local population was estimated using the following equation (UNSCEAR, 2000):

where HInh is the annual effective dose from inhaling radon from domestic water used, calculated in mSv/year, Cliq is the concentration of radon gas in water samples (Bq/m³). Rw and Ra are the concentrations of radon in water and air, respectively (Ra/Rw = 10⁻⁴). EF (0.42) is the equilibrium factor for radon and Ti (0.82) is the time an individual spends indoors are for the Himalayan regions of Garhwal (Choubey & Ramola,1997; Ramola et al., 2016), and DCF is the dose conversion factor (mSv/(year Bq/m3)) given by the National Research Council (National Research Council, Commission on Life Sciences, 1999).
To calculate the equivalent dose in the whole lung, we have used the DCF value of 0.007 mSv/(year Bq/m3) given by the National Research Council.
The annual mean effective dose (E) was calculated for different body organs from the UNSCEAR relations (UNSCEAR 2008).

where Wtissue is the tissue weighting factor, as defined in ICRP pubication 103 (Charles, 2008), and E is the measured effective dose per inhalation (mSv/Year).
2.7. Calculation of excess lifetime cancer risk (ELCR)
The Excess lifetime cancer risk (ELCR) was calculated by the local population was estimated using the following equation (Eckerman et al., 2012).

where E(ingestion, inhalation) is the annual effective dose due to ingestion and inhalation of water (mSv/year), ADL is the average duration of life for the Republic of Congo (66 years) and RF is a risk factor (0.00005 mSv-1) (Eckerman et al., 2012).
3. RESULTS AND DISCUSSION
3.1. Results
The value of average for the radon concentration in drinking water samples obtained in this study is 425 ± 120 Bq/m3 whether 0.425 ±0.12Bq/L. The minimum value is 230 Bq/m3 whether 0.23 Bq/L and the maximum value is 730 Bq/m3 whether 0.73 Bq/L.
The mean values of the risks of cancer mortality associated with the life-long ingestion of radon dissolved in water obtained in this study are: 6.35 x 10⁻⁸ ± 1.72 x 10⁻⁷ for the male, 7.88 x 10⁻⁸ ± 2.43 x 10⁻⁷ for the female and 6.4 x 10⁻⁸ ± 1.94 x 10⁻⁷ for both.
Table 1 presents the results of equivalent dose and effective dose for non-diffusion, the case of bases, and saturated water diffusion in the stomach. Table 2 presents the results of equivalent dose and effective dose for various subjects (baseline assumption regarding radon diffusion into the stomach wall) and Table 3 presents the results of lifetime cancer mortality risk.
The Equivalent dose in the Whole lung for inhalation obtained in this study is 3.59 mSv/Year and the effective dose is 0.431 mSv/Year. The effective dose for the whole lung has been calculated using equation (7); we have used 0.12 as the weighting factor given in ICRP publication 103.
Table 1 shows that the impact of an alpha particle is greater in the case of non-diffusion and saturated water diffusion in the stomach. The effective dose is higher in the case of saturated water diffusion and regular diffusion. The results of Table 2 show that the impact of alpha particles is more pronounced in infants than in other age groups (children and adults). We also observed that adults are less exposed than others. Additionally, we found that in the specific case of the stomach, the impact of alpha particles is more pronounced than in the case of other organs. Hence, particular attention should be paid to studying the behavior of radon in the stomach.
|
Table 1. Equivalent and effective dose of radon ingested (Sv/L) in the adult as a function of diffusion into the stomach wall. |
||||
|
Organ |
Uptake in Stomach Wall |
|
||
|
No Diffusion* |
Base case** |
Saturated Diffusion*** |
|
|
|
Adrenals |
3.32×10⁻10 |
8.50×10⁻11 |
1.28×10⁻10 |
|
|
Bladder |
1.45×10⁻10 |
4.21×10⁻11 |
5.95×10⁻10 |
|
|
Endosteal Tissue |
2.98×10⁻09 |
7.65×10⁻10 |
1.19×10⁻09 |
|
|
Brain |
3.27×10⁻10 |
8.50×10⁻11 |
1.28×10⁻10 |
|
|
Breast Tissue |
1.19×10⁻10 |
3.61×10⁻11 |
5.10×10⁻11 |
|
|
Stomach Wall |
3.78×10⁻10 |
1.02×10⁻08 |
1.32×10⁻07 |
|
|
Small Intestine |
5.10×10⁻10 |
6.80×10⁻11 |
1.32×10⁻09 |
|
|
Upper Large Intestine |
6.38×10⁻10 |
5.53×10⁻11 |
2.34×10⁻10 |
|
|
Lower Large Intestine |
1.11×10⁻09 |
7.23×10⁻11 |
2.76×10⁻10 |
|
|
Kidneys |
1.79×10⁻09 |
5.10×10⁻10 |
8.50×10⁻10 |
|
|
Liver |
4.68×10⁻10 |
7.23×10⁻10 |
8.93×10⁻10 |
|
|
Muscle |
2.13×10⁻10 |
5.95×10⁻11 |
8.50×10⁻11 |
|
|
Ovaries |
1.32×10⁻10 |
3.70×10⁻11 |
5.53×10⁻11 |
|
|
Pancreas |
3.74×10⁻10 |
3.95×10⁻11 |
1.45×10⁻10 |
|
|
Red Marrow |
3.06×10⁻09 |
7.65×10⁻10 |
1.15×10⁻09 |
|
|
Spleen |
2.89×10⁻10 |
5.95×10⁻11 |
1.28×10⁻10 |
|
|
Testes |
2.47×10⁻10 |
6.38×10⁻11 |
9.35×10⁻11 |
|
|
Esophagus |
1.19×10⁻10 |
3.57×10⁻11 |
5.10×10⁻11 |
|
|
Thyroid |
3.23×10⁻10 |
8.50×10⁻11 |
1.23×10⁻10 |
|
|
Uterus |
1.28×10⁻10 |
3.66×10⁻11 |
5.53×10⁻10 |
|
|
Lung |
2.00×10⁻10 |
5.78×10⁻11 |
8.08×10⁻11 |
|
|
Effective Dose |
7.13×10⁻04 |
1.09×10⁻03 |
1.18×10⁻02 |
|
*The non-diffusion of radon in the stomach is the fact that radon does not penetrate significantly or spread deeply through the stomach tissues before being eliminated or decaying.
**The term base case means that ingested radon remains temporarily dissolved in the gastric contents, undergoes limited diffusion into gastric tissues, and is rapidly eliminated from the gastrointestinal system.
***The saturated diffusion of radon in the stomach is the case where the gastric fluid or surrounding tissues contain radon around their maximum equilibrium concentration, so that further radon transfer becomes very slow or limited.
|
Table 2. Equivalent dose (Sv/L) and effective dose(mSv/Year) of radon ingested for various subjects (base case assumption regarding diffusion of into the stomach wall). |
||||||
|
Organ |
Age at Intake (year) |
|||||
|
Infant |
1-year |
5-year |
10-year |
15-year |
Adult |
|
|
Adrenals |
1.06×10⁻09 |
4.25×10⁻10 |
2.17×10⁻10 |
1.28×10⁻10 |
9.78×10⁻11 |
8.50×10⁻11 |
|
Bladder |
2.68×10⁻10 |
1.96×10⁻10 |
1.11×10⁻10 |
5.95×10⁻11 |
4.68×10⁻11 |
4.21×10⁻11 |
|
Endosteal |
6.38×10⁻09 |
4.68×10⁻09 |
2.13×10⁻09 |
1.40×10⁻09 |
1.15×10⁻09 |
7.65×10⁻09 |
|
Brain |
5.10×10⁻10 |
4.21×10⁻10 |
2.13×10⁻10 |
1.23×10⁻10 |
9.35×10⁻11 |
8.50×10⁻11 |
|
Breast |
2.51×10⁻10 |
1.83×10⁻10 |
1.02×10⁻10 |
5.53×10⁻11 |
4.12×10⁻11 |
6.61×10⁻11 |
|
Stomach Wall |
1.28×10⁻07 |
6.80×10⁻08 |
3.10×10⁻08 |
1.79×10⁻08 |
1.32×10⁻08 |
1.02×10⁻08 |
|
Small Intestine |
5.10×10⁻10 |
3.36×10⁻10 |
1.79×10⁻10 |
1.06×10⁻10 |
7.65×10⁻11 |
6.80×10⁻11 |
|
Upper Large Intestine |
4.17×10⁻10 |
2.85×10⁻10 |
1.62×10⁻10 |
9.35×10⁻11 |
6.38×10⁻11 |
5.53×10⁻11 |
|
Lower Large Intestine |
5.53×10⁻10 |
3.70×10⁻10 |
2.08×10⁻10 |
1.19×10⁻10 |
8.08×10⁻11 |
7.23×10⁻11 |
|
Kidneys |
2.59×10⁻09 |
1.74×10⁻09 |
8.93×10⁻10 |
5.53×10⁻10 |
3.95×10⁻10 |
5.10×10⁻10 |
|
Liver |
6.38×10⁻09 |
5.10×10⁻09 |
1.57×10⁻09 |
1.02×10⁻09 |
5.95×10⁻10 |
7.23×10⁻10 |
|
Muscle |
3.49×10⁻10 |
2.81×10⁻10 |
1.45×10⁻10 |
8.08×10⁻11 |
6.38×10⁻11 |
5.95×10⁻11 |
|
Ovaries |
2.59×10⁻10 |
1.87×10⁻10 |
1.06×10⁻10 |
5.95×10⁻11 |
4.25×10⁻11 |
3.70×10⁻11 |
|
Pancreas |
2.98×10⁻10 |
1.87×10⁻10 |
1.06×10⁻10 |
6.38×10⁻11 |
4.68×10⁻11 |
3.95×10⁻11 |
|
Red Marrow |
4.04×10⁻09 |
3.61×10⁻09 |
1.79×10⁻09 |
1.06×10⁻09 |
8.50×10⁻10 |
7.65×10⁻10 |
|
Spleen |
5.53×10⁻10 |
1.91×10⁻10 |
1.19×10⁻10 |
7.65×10⁻10 |
7.23×10⁻11 |
5.95×10⁻11 |
|
Testes |
9.35×10⁻10 |
3.19×10⁻11 |
1.66×10⁻10 |
9.35×10⁻11 |
7.23×10⁻11 |
6.38×10⁻11 |
|
Thymus |
2.51×10⁻10 |
1.79×10⁻10 |
1.02×10⁻10 |
5.53×10⁻11 |
4.12×10⁻11 |
3.57×10⁻11 |
|
Thyroid |
6.38×10⁻10 |
4.12×10⁻10 |
2.13×10⁻10 |
1.23×10⁻10 |
9.35×10⁻11 |
8.50×10⁻11 |
|
Uterus |
2.55×10⁻10 |
1.83×10⁻10 |
1.09×10⁻10 |
5.53×10⁻11 |
4.21×10⁻11 |
3.66×10⁻11 |
|
Lung |
3.87×10⁻10 |
3.06×10⁻10 |
1.62×10⁻10 |
8.93×10⁻11 |
6.80×10⁻11 |
5.53×10⁻11 |
|
Effective Dose |
4.02×10⁻03 |
4.02×10⁻03 |
2.03×10⁻03 |
1.18×10⁻03 |
4.38×10⁻06 |
5.37×10⁻06 |
|
Table 3. Cancer mortality risk associated with the lifetime ingestion of radon in drinking water. |
|||
|
Cancer Site |
Males |
Females |
Both Sexes |
|
Esophagus |
6.38×10⁻10 |
1.40×10⁻09 |
9.35×10⁻10 |
|
Stomach |
5.53×10⁻07 |
8.50×10⁻07 |
6.80×10⁻07 |
|
Colon |
1.96×10⁻08 |
3.27×10⁻08 |
2.51×10⁻08 |
|
Liver |
2.89×10⁻08 |
1.87×10⁻08 |
2.47×10⁻08 |
|
Lung |
1.11×10⁻08 |
1.91×10⁻08 |
1.45×10⁻08 |
|
Bone |
2.30×10⁻09 |
2.42×10⁻09 |
2.34×10⁻09 |
|
Breast |
- |
4.25×10⁻09 |
1.91×10⁻09 |
|
Ovary |
- |
2.59×10⁻09 |
1.91×10⁻09 |
|
Bladder |
3.32×10⁻09 |
1.57×10⁻09 |
2.55×10⁻09 |
|
Kidney |
7.65×10⁻09 |
4.68×10⁻09 |
3.38×10⁻09 |
|
Thyroid |
5.53×10⁻10 |
1.32×10⁻09 |
8.93×10⁻10 |
|
Leukemia |
8.08×10⁻09 |
6.38×10⁻09 |
7.23×10⁻09 |
|
Total |
6.35×10⁻07 |
9.45×10⁻07 |
7.68×10⁻07 |
3.2. Discussion
This study clearly shows that the stomach is the organ most exposed to radon in the case of drinking water ingestion. Our study indicates that infants should be exempt from drinking river Djiri water directly without prior treatment, as they face a higher risk compared to other age groups. The results of the effective dose also confirm that infants are more exposed than other age ranges.
The risks of cancer mortality associated with the life-long ingestion of radon dissolved in water at a concentration of 425 Bq/m3 are presented in Table 3. The total risk of mortality from cancer of all organs for males, females, and both sexes are, respectively: 6.35 x 10⁻⁷; 9.45 x 10⁻⁷, and 7.68 x 10⁻⁷. The total cancer mortality risk value obtained in this study for females is relatively higher than that for males, although the difference was not statistically significant (p = 0.76). These results are in the same direction as the hypothesis, which stipulates that females are more radiosensitive than males regarding the development of certain cancers after exposure to radiation (Biegon et al., 2022). Although our estimated risks (obtained at 425 Bq/m3) are numerically higher than the raw National Research Council value at 1 Bq/m3 (0.2 x 10⁻⁸) (National Research Council, Commission on Life Sciences, 1999), they are fully consistent with the National Research Council projection when both are expressed at the same exposure level. Indeed, extrapolating the National Research Council risk to 425 Bq/m3 gives , which closely matches our estimates (ranging from 6.35 x 10⁻⁷ to 9.45 x 10⁻⁷).
Despite the low radon concentrations and correspondingly low effective doses (all below the WHO guideline), the lack of formal water distribution infrastructure in the communities adjacent to the LCDE treatment plant necessitated a specific risk assessment for the local population. The results show that the potential excess risk of stomach cancer is negligible (on the order of 10-7), and does not support a causal link between water consumption from the Djiri river and stomach cancer incidence. Nonetheless, the lack of formal water treatment underscores the importance of periodic radon monitoring as part of a public health surveillance strategy.
Figure 2 reveals a pronounced age-dependent decline in estimated doses. Infants and 1-year-old children exhibited the highest value (4.02 x 10⁻³ mSv/Year), which is approximately 749 times higher than that of adults (5.37 x 10⁻⁶ mSv/Year). This trend reflects the higher water consumption per unit body weight and the greater physiological radiosensitivity of the younger age group. Table 5 presents the comparison of our results with other studies worldwide. This comparison shows that our results for infants, one-year-olds, five-year-olds, and ten-year-olds are relatively high compared to the results obtained in Tehran (Iran) (Alirezazadeh, 2005) and Balaton (Netherlands) (Somlai et al., 2007). On the other hand, these results are relatively low compared to those obtained in Minab (Iran) (Fakhri et al., 2015). In the case of fifteen-year-olds and adults, the results of this study are relatively low compared to those obtained in Tehran (Iran), Balaton (Netherlands), and Minab (Iran).
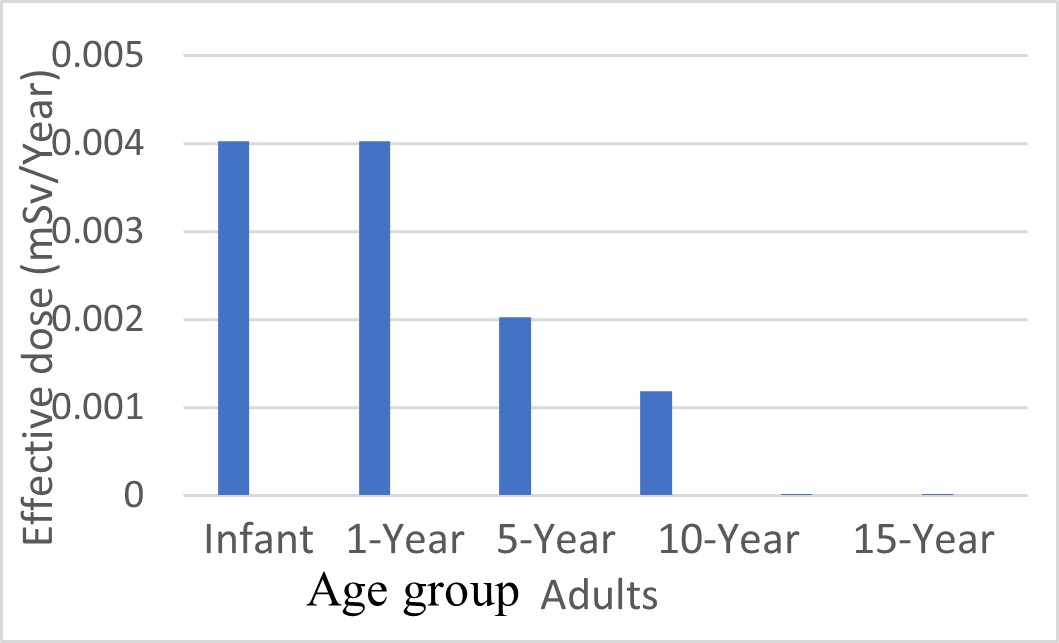
The overall radiation dose due to radon emanating from the Djiri river decreases as age increases, but it is significantly below the threshold of 0.1 mSv/year recommended by UNSCEAR and WHO for public safety (UNSCEAR 2000).
The statistical comparison of these results by age group (infant, one-year-old, five-year-old, ten-year-old, fifteen-year-old children and adults) shows a relatively significant variation in the coefficients of variation, which is 27.7 % for all age groups.
The proportion of the effective dose received by infants, children aged one, five, ten, fifteen years, and adults relative to the standard limit of 0.1 mSv is as follows: 4.02 %; 4.02 %; 2.03 %; 1.18 %; 4.38 x 10⁻³ %; 5.37 x 10⁻³ % respectively. In order to determine whether there was a significant difference between the effective dose results obtained from the different age groups, a two-tailed Student’s T-Test was used. Since the P-value between the effective dose received by infants and one-year-old children groups was 0.17, no significant difference can be said to exist between them (P-value>0.05). However, the P-value of 8.18 x 10⁻¹²; 8.17 x 10⁻¹⁹; 1.61 x 10⁻²⁶ and 1.63 x 10⁻²⁶ (P-value <0.05) between the effective doses received respectively by infants and children aged five, ten, fifteen years, and adults revealed a significant divergence between these groups. Similarly, the P-values were 1.82 x 10⁻¹³; 1.08 x 10⁻¹⁹; 1.52 x 10⁻²⁶ and 1.54 x 10⁻²⁶ (P-value < 0.05) between the effective dose received by children aged one year and those of five years, ten years, fifteen years, and adults revealed a significant divergence between these groups. The P-values are 2.70 x 10⁻⁹; 1.58 x 10⁻²⁶ and 1.61 x 10⁻²⁶ between the effective dose received by children aged five years and those of ten years, fifteen years, and adults, revealed a significant divergence between these groups. Similarly, the P-values of 1.84 x 10⁻²⁶ and 1.92 x 10⁻²⁶ between the effective dose received, respectively, by children aged ten years and those of fifteen years, and adults, revealed a significant divergence between these groups. In the same order, the P-value=0.007 (P-value < 0.05) between the effective dose received by children aged fifteen years and adults revealed a significant divergence between these groups.
Table 4 indicates that the equivalent dose to T-lymphocytes (5.13 mSv/Year) is greater than that recorded for the other tissues. This result suggests that T-lymphocytes may exhibit higher radiosensitivity under the conditions of this study, although this observation should be interpreted with caution given the limitation of the dosimetric model used.
|
Table 4. The equivalent dose to tissues other than the lung (mSv/Year) and the total effective dose (mSv/Year) for continuous exposure to 425 Bq/m3 of Radon-222 for inhalation. |
||
|
Tissues |
Equivalent dose (HT) |
Effective dose (Etotal) |
|
Liver |
0.026 |
Etotal=0.075 |
|
Kidneys |
0.029 |
|
|
Spleen |
0.027 |
|
|
Red Bone Marrow |
0.049 |
|
|
Bone Surfaces |
0.013 |
|
|
Soft Tissue |
0.015 |
|
|
Adipose Tissue |
0.046 |
|
|
Skin |
0.256 |
|
|
Normal Marrow |
0.032 |
|
|
Adipose Tissue Marrow |
0.082 |
|
|
Bone Surfaces (Normal Marrow) |
0.008 |
|
|
Bone Surfaces (Adipose Tissue Marrow) |
0.015 |
|
|
T Lymphocytes |
5.13 |
|
|
Alveolar Capillaries |
0.103 |
|
|
Table 5. Comparison of the annual effective dose received by age group of infants, children, and adults caused by the ingestion of water from the Djiri River (Congo) and other countries. |
||||||
|
Town/ Country |
Drinking water (stomach) mSv/Year |
|||||
|
Age at intake (year) |
||||||
|
Infant |
1-year |
5-year |
10-year |
15-year |
Adults |
|
|
Present Study |
4.02×10⁻3 |
4.45×10⁻3 |
2.03×10⁻3 |
1.20×10⁻3 |
4.38×10⁻6 |
5.37×10⁻6 |
|
Teheran/Iran (Alirezazadeh, 2005) |
1.29×10⁻4 |
1.29×10⁻4 |
1.29×10⁻4 |
1.29×10⁻4 |
1.29×10⁻4 |
1.29×10⁻4 |
|
Balaton/Pays-Bas (Somlai et al., 2007) |
0.40×10⁻3 |
0.40×10⁻3 |
0.40×10⁻3 |
0.40×10⁻3 |
0.40×10⁻3 |
0.40×10⁻3 |
|
Minab/Iran1 (Fakhri et al.,2015) |
1.1×10⁻2 |
1.1×10⁻2 |
1.1×10⁻2 |
1.1×10⁻2 |
1.1×10⁻2 |
1.1×10⁻2 |
|
Minab/Iran2 (Fakhri et al., 2015) |
0.7×10⁻2 |
0.7×10⁻2 |
0.7×10⁻2 |
0.7×10⁻2 |
0.7×10⁻2 |
0.7×10⁻2 |
The equivalent dose to T-lymphocytes (5.13 mSv/Year) is higher than that to the whole lung (3.5 mSv/Year), indicating a greater radiosensitivity of this lymphoid tissue.
Conversely, the effective dose to the lungs (0.431 mSv/Year) exceeds that to all other tissues (0.075 mSv/Year), including T-lymphocytes. This indicates that the lungs are the main contributors to the overall effective dose, although T-lymphocytes exhibit higher radiosensitivity based on their equivalent dose (5.13 mSv/year).
The estimated lifetime excess cancer risk (ELCR) associated with radon exposure was 1.4 x 10⁻³ for the whole lung, compared with 2.5 x 10⁻⁴ for all other tissues combined. Regarding ingestion exposure, the ELCR decreased with increasing age: the highest values were observed in infants and 1-year-old children (1.3 x 10⁻⁵ each), followed by 5-year-old children (7 x 10⁻⁶), 10-year-old children (3.9 10-6) and finally 15-year-old children (1.5 x 10⁻⁸) and adults (1.8 x 10⁻⁸).
These findings indicate that the estimated ELCR for all age groups, from both ingestion and inhalation exposure, does not exceed the recommended safety threshold of 1.45 x 10⁻³ established by UNSCEAR (UNSCEAR, 2000).
However, several limitations should be acknowledged. First, our risk estimates are based on a single sampling campaign, which may not capture seasonal or inter-annual variations in radon concentrations. Second, the sample size, while sufficient for a preliminary assessment, limits the statistical power for detecting subtle differences between subgroups or for robustly characterizing extreme values. Finally, the generalizability of our findings to other communities or to different hydrogeological contexts may be limited, as radon levels are strongly influenced by local geology and water supply characteristics.
4. CONCLUSIONS
This study indicates that the water of the Djiri River does not pose a significant public health risk with respect to radon exposure. The measured radon concentrations and the corresponding estimated equivalent and effective doses remained well below the safety limits recommended by current international radiological protection guidelines.
Although the estimated lifetime cancer mortality risk was slightly higher for females than for males, this difference was not statistically significant (p = 0.76). The statistical analysis by age group revealed variations in the coefficients of variation, reflecting differences in age-dependent dose conversion factors and water consumption rates rather than elevated environmental radon concentrations.
Overall, the estimated Excess Lifetime Cancer Risk (ELCR) values for all age groups, considering both ingestion and inhalation exposure pathways, remained below the UNSCEAR reference level of 1.45×10⁻³. These findings indicate that, under the conditions investigated, exposure to radon through Djiri River water is unlikely to pose a significant radiological health risk to the local population.
However, this study has some limitations. The assessment was based on a single sampling campaign and therefore does not account for possible seasonal or interannual variations in radon concentration. Future monitoring programs should include quarterly sampling campaigns covering both the dry and rainy seasons, with particular attention to areas characterized by higher geological susceptibility to radon occurrence and to groundwater sources contributing to the river system.
As the first investigation of radon in river water conducted in the Republic of Congo, this study provides valuable baseline data for future environmental monitoring, radiological risk assessment, and the development of national strategies for the radiological protection of drinking water resources.
REFERENCES
- Alirezazadeh, N., 2005. Radon concentrations in public water supplies in Tehran and evaluation of radiation dose. Iranian Journal of Radiation Research, 3(2), 79-83.
- AlphaGuard, 2008. User manual portable radon monitor “AlphaGUARD”, 12/98.Saphymo GmbH Heerstraẞe 149, D60488. Frankfurt am Main/Germany.
- Appleton, J. D., 2012. Radon in air and water. In Essentials of medical geology: Revised edition (pp. 239-277). Dordrecht: Springer Netherlands.
- AquaKIT, 2008. Accessory for radon in water measurement in combination with the radon monitor AlphaGUARD,12/2008. Saphymo GmbH Heerstraẞe 149, D60488. Frankfurt Main/Germany.
- Barbosa-Lorenzo, R., Barros-Dios, J. M., & Ruano-Ravina, A., 2017. Radon and stomach cancer. International Journal of Epidemiology, 46(2), 767-768, https://doi.org/10.1093/ije/dyx011.
- Biegon, A., Cohen, S., & Franceschi, D., 2022. Modulation of secondary cancer risks from radiation exposure by sex, age and gonadal hormone status: Progress, opportunities and challenges. Journal of Personalized Medicine, 12(5), 725, https://doi.org/10.3390/jpm12050725.
- Bulut, H. A., & Şahin, R., 2024. Radon, concrete, buildings and human health - a review study. Buildings, 14(2), 510, https://doi.org/10.3390/buildings14020510.
- Charles, M. W., 2008. ICRP Publication 103: Recommendations of the ICRP. Vol. 129, No. 4, pp. 500–507, https://doi.org/10.1093/rpd/ncn187.
- Choubey, V. M., & Ramola, R. C., 1997. Correlation between geology and radon levels in groundwater, soil and indoor air in Bhilan gana Valley, Garhwal Himalaya, India. Environmental Geology, 32:258–262, https://doi.org/10.1007/s002540050215.
- Dobrzyńska, M. M., Gajowik, A., & Wieprzowski, K., 2023. Radon–occurrence and impact on the health. Roczniki Państwowego Zakładu Higieny, 74(1), 5-14, https://doi.org/10.32394/rpzh.2023.0242.
- Eckerman K., Harrison J., Menzel G.H., & Clement H.C., 2012. Annals of the ICRP Compendium of Dose Coefficients based on ICRP Publication 60. Vol. 41, No. 1, pp. 1-130, https://doi.org/10.1016/j.icrp.212.06.038.
- Elzain, H. E., Abdalla, O., Al-Maktoumi, A., Kacimov, A., & Eltayeb, M., (2024). A novel approach to forecast water table rise in arid regions using stacked ensemble machine learning and deep artificial intelligence models. Journal of Hydrology, 640, 131668, https://doi.org/10.1016/j.jhydroi.2024.131668.
- Fakhri, Y., Kargosha, M., Langarizadeh, G., Zandsalimi, Y., Amirhajeloo, L. R., Moradi, M., Moradi, B., & Mirzaei, M., 2015. Effective dose radon 222 of the tap water in children and adults people; Minab City, Iran. Global journal of health science, 8(4),234, https://doi.org/10.5539/gjhs.v8n4p234.
- Grzywa-Celińska, A., Krusiński, A., Mazur, J., Szewczyk, K., & Kozak, K., 2020. Radon—the element of risk. The impact of radon exposure on human health. Toxics, 8(4), 120, https.//doi.org/10.3390/toxics8040120.
- Isola, G., Giudice, A. L., Polizzi, A., Alibrandi, A., Murabito, P., & Indelicato, F., 2021. Identification of the different salivary Interleukin-6 profiles in patients with periodontitis: A cross-sectional study. Archives of Oral Biology, 122, 104997, https://doi.org/10.1016/j.archoralbio.2020.104997.
- Jha, S. K., Patra, A. C., Verma, G. P., Iyer, I. S., & Aswal, D. K., 2024. Natural radiation and environment. In Handbook on Radiation Environment, Volume 1: Sources, Applications and Policie (pp. 27-72). Singapore: Springer Nature Singapore. https://doi.org/10.1007/978-981-1102-4_1.
- Kendall, G. M., & Smith, T. J., 2002. Doses to organs and tissues from radon and its decay products. Journal of Radiological Protection, 22(4), 389, https://doi.org/10.1088/0952-4746/22/4/304.
- Coţac, V. N., Iancu, O. G., Necula, N., Sandu, M. C., Loghin, A. A., Ion, A., & Loghin, S., 2024. Naturally occurring radionuclides and their radiological risk assessment in river sediments from the Ditrau Alkaline Massif. Carpathian Journal of Earth and Environmental Sciences, 19(1), 135-146, https.//doi.org/10.26471/cjees/2024/019/285.
- Genitron Instruments, 1998. AlphaGUARD portable radon monitors user manual.
- Li T., Wang N., & Li S., 2015. Preliminary investigation of radon concentration in surface water and drinking water in Shenzhen City, South China. Radiation Protection Dosimetry, 167(1–3): 59–64. https://doi.org/10.1093/rpd/ncv207.
- Şahin Bal, S., Tanrıverdi, E., Yalçın, S., Doğru, M., & Özbey, F., 2021. The radon concentrations of some waters in Bitlis (Turkey) and their dose estimates. Environment, Development and Sustainability, 23(12), 17650-17667, https://doi.org/10.1007/s10668-021-01404-1.
- Liu, Y., Xu, Y., Xu, W., He, Z., Fu, C., & Du, F. (2024). Radon and lung cancer: current status and future prospects. Critical Reviews in Oncology/Hematology, 104363, https://doi.org/10.1016/j.critrevonc.2024.10436.3.
- Madhav, S., Ahamad, A., Singh, A. K., Kushawaha, J., Chauhan, J. S., Sharma, S., & Singh, P., 2020. Water pollutants: sources and impact on the environment and human health. Sensors in water pollutants monitoring: Role of material, 43-62. https://doi.org/10.1007/978-981-15-0671-0_1.
- Maier, A., Wiedemann, J., Rapp, F., Papenfuß, F., Rödel, F., Hehlgans, S., Gaipl, U. S., Kraft, G., Fournier, C., & Frey, B., 2020. Radon exposure—therapeutic effect and cancer risk. International Journal of Molecular Sciences, 22(1), 316, https://doi.org/10.3390/ijms22010316.
- Mouzeo, K., 1986. Transport particulaire actuel du fleuve Congo et de quelques affluents; enregistrement quaternaire dans l’éventail détritique profond (sédimentologie, minéralogie et géochimie). Thèse de Doctorat de l'Universitéde Perpignan.
- National Research Council, Commission on Life Sciences, 1999. Board on Radiation Effects Research, & Committee on Risk Assessment of Exposure to Radon in Drinking Water. Risk assessment of radon in drinking water.
- Ramola, R. C., Prasad, M., Kandari, T., Pant, P., Bossew, P., Mishra, R., & Tokonami, S., 2016. Dose estimation derived from the exposure to radon, thoron and their progeny in the indoor environment. Scientific reports, 6(1), 31061, https://doi.org/10.1038/srep31061.
- Rožmarić, M., Rogi, M., Benedik, L., & Štrok, M., 2012. Natural radionuclides in bottled drinking waters produced in Croatia and their contribution to radiation dose. Science of the Total Environment, 437, 53-60, http://doi.org/10.1016/j.scitotenv.2012.07.018.
- Saphymo, 2007. AquaKIT User Manual. SAPHYMO, Frankfurt am Main, Germany.
- Somlai, K., Tokonami, S., Ishikaw, T., Vancsur, P., Gáspár, M., Jobbágy, V., Somlai, J., & Kovács, T., 2007. 222Rn concentrations of water in the Balaton Highland and in the southern part of Hungary, and the assessment of the resulting dose. Radiation Measurements, 42, 491-495, http://doi.org/10.1016/j.radmeas.2006.11.006.
- United Nations Scientific Committee on the Effects of Atomic Radiation, 2000. Sources and Effects of Ionizing Radiation, United Nations Scientific Committee on the Effects of Atomic Radiation (UNSCEAR) 2000 report, volume I: report to the general assembly, with scientific annexes-sources. United Nations.
- United Nations. Scientific Committee on the Effects of Atomic Radiation, 2010. Sources and effects of ionizing radiation: United Nations Scientific Committee on the Effects of Atomic Radiation: UNSCEAR 2008 report to the General Assembly, with scientific annexes. United Nations
- Vogiannis, E. G., & Nikolopoulos, D., 2015. Radon sources and associated risk in terms of exposure and dose. Frontiers in public health, 2, 207, https://doi.org/10.3389/fpubh.2014.00207.
- Vorobeva, D. I., & Gaevaya, E. V., 2023. Radon in the environment. In Арктика: современные подходы к производственной и экологической безопасности в нефтегазовом секторе (pp. 175-179), https://doi.org/10.1186/s42834-023-00174-x.